

EUR/USD bulls eye 50-day EMA
On the four-hour chart, EUR/USD has been trading in a descending channel since mid-February, with the price forming lower tops and lower bottoms below the fast and slow EMAs. ECB's hawkish action of a jumbo 75 basis points rate hike on Thursday improved the sentiment for the single currency, which caused the pair to bounce back after the sellers' effort fizzled out around a twenty-year low at 0.98630.
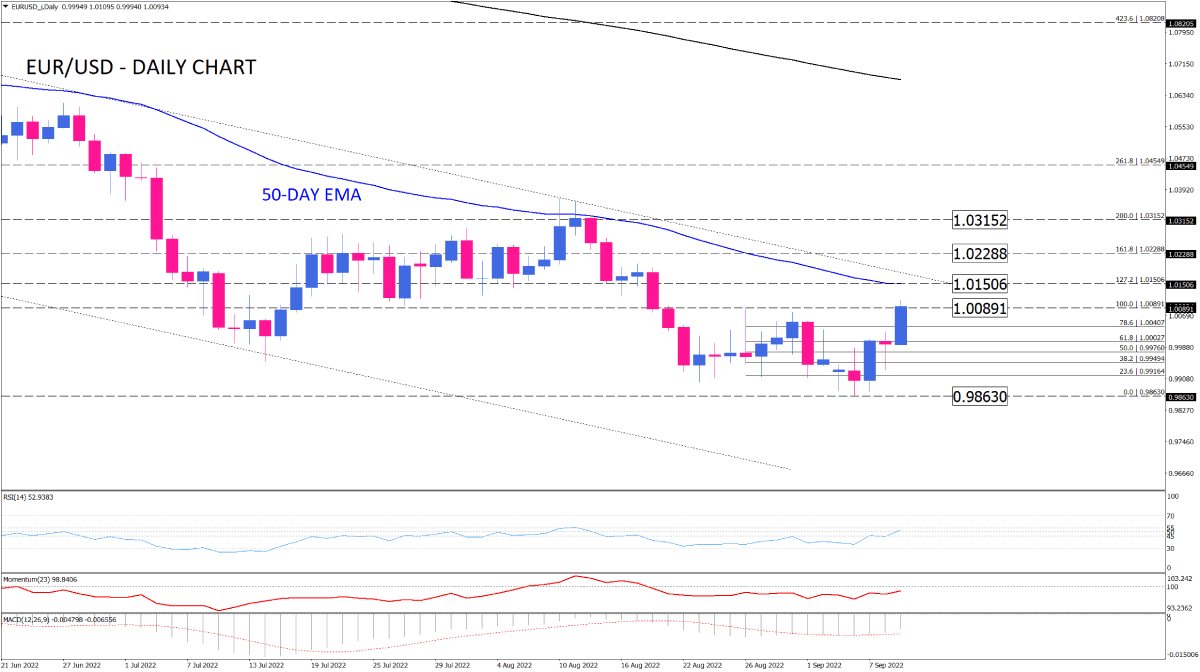
That move has motivated buyers to capture the ground above the 1.00891 barrier. Closing the day above this key barrier will confirm the completion of a non-failure swing pattern. Upon taking the field above this level, the price can encounter the initial resistance at 1.01506, which is in line with the 50-day EMA. The importance of the 50-EMA is that this level also aligns with the channel resistance line. Hence, if this dynamic resistance fails, the market will witness a broader reversal to the upside. With a sustained break, we can see scope for extensions towards the 161.8% Fibonacci projection, which lines up with 1.02288. further traction may lead the pair higher to reconquer the two-month top around 1.03152.
On the flip side, should the channel remain intact, a prevailing bearish momentum can back the price down to test the key 0.98630 level again. By piercing through this region, sellers may aim for the 0.9800
Short-term momentum oscillators are pushing their direction to the upside, indicating the negative momentum is waning. RSI is holding within a range zone around the 50-level after posting a divergence with the price. Momentum shows a sign of bottoming in the selling area, recovering towards the 100-mark. MACD histogram is shrinking in the negative area above the signal line, which implies fading bearish bias. However, with the oscillators still in the selling area and the price on the verge of a key resistance level, sellers may wait for a clear breakout before taking further action.
Technical Analysis
Discover ideal profit opportunities for your everyday trading with the help of our in-depth technical insights comprised of facts, charts and trends.


