

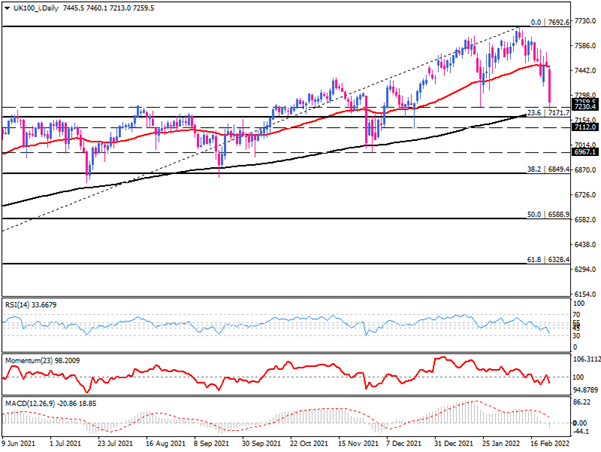
FTSE100 sellers confront 200-day EMA
The UK100 index has suffered heavy losses in the morning trading session on Thursday and slumped to the one-month low around 7233. The confluence of several support areas at the one-month low around 7233, which lines up with the 200-day exponential moving average, in the vicinity of the 23.6% retracement of the prior uptrend has temporarily stopped further declines. However, sellers have the upper hand, and intensifying bearish momentum can lead to retesting this area again as risk aversion increases. If bears breach this key level of interest, prices can fall to November's low at 6967. An extension of the decline would lead to testing the 6849 barrier, which is in line with 38.2% Fibonacci retracement.
On the upside, if the 200-day EMA holds firm support as it has done in the last two years, it would boost the FTSE all the way up to the 50-day EMA.
Momentum oscillators support a bearish bias. RSI is pointing downward in the selling area. Momentum is tumbling after rebounding to the 100-threshold. The MACD bar has just crossed below the zero line into the selling area.
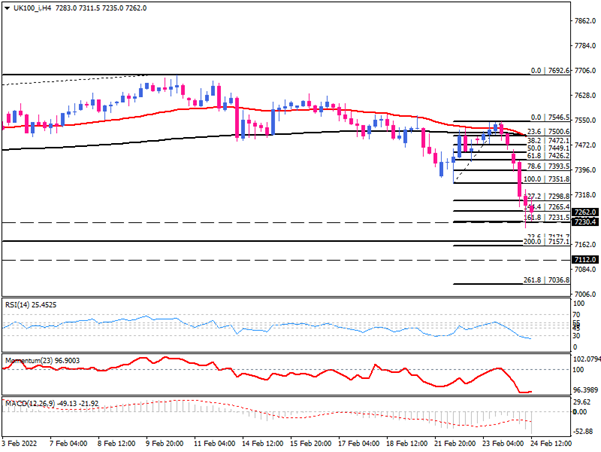
Short-term view
A look at the four-hour chart shows the decline is ongoing, and it appears that sellers intend to test the 161.8% Fibonacci level again. A further drop could push the index into an influential support area below the one-month low. As selling bias persists, the next immediate resistance lies between 7171 and 7157. In addition to forming lower tops and lower bottoms, the EMAs are about to cross over, endorsing continuing downward movement.
However, the deep sinking of momentum oscillators in the sales area can signify sellers' fatigue. So, we can expect to see another lower top while the downtrend is intact. RSI below the 30 level indicates that sellers are likely to take a break in the short term. Momentum has flattened deep in the selling area. The MACD is trending downward below the zero line.
Technical Analysis
Discover ideal profit opportunities for your everyday trading with the help of our in-depth technical insights comprised of facts, charts and trends.


