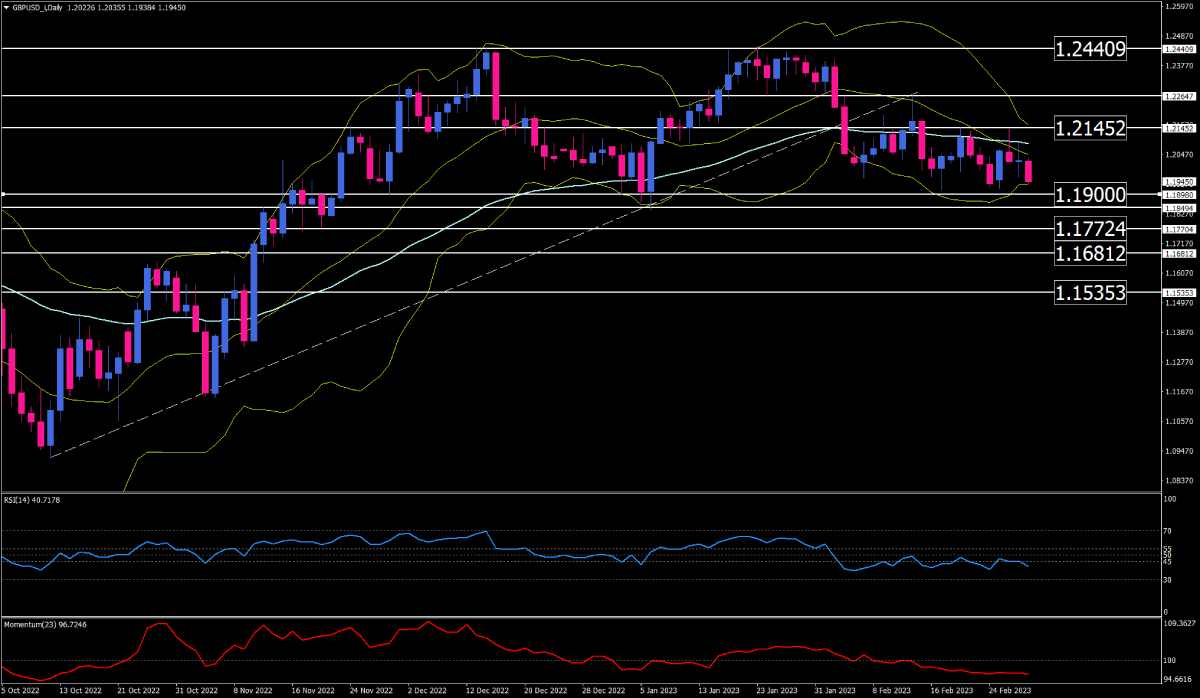
GBP/USD Faces Critical support as Sellers Take Control
GBP/USD is currently trading at the end of an uptrend on the daily chart. The buyers have lost control of the market after failing to reach a price peak above 1.24409, and the price has caught the attention of the sellers by breaking the upward trend line. The Bollinger bands have compressed, and the 50-day exponential moving average has moved horizontally while the price fluctuates around the support of 1.19. These factors suggest that the sellers lack sufficient strength, but with the price being in the lower half of the bands and considering the bands' downward slope, it is expected that the price will test this important support level again.
Further weakening of the pound could increase the bearish momentum of the market, and a break of the psychological support of 1.1900 may lead to the price moving towards 1.17724 and 1.16812. If the selling pressure persists below these crucial levels, the focus will shift towards 1.15353.
On the other hand, if buyers return, they will aim to attack the range ceiling of 1.21452. A sustained break above this resistance level will indicate a breach of the Bollinger squeeze to the upside.
Short-term momentum oscillators suggest that sellers are dominating the market. The Relative Strength Index (RSI) has entered the selling zone from the neutral zone and is moving downwards. Additionally, momentum confirms the presence of more sellers below the 100-level.

Technical Analysis
Discover ideal profit opportunities for your everyday trading with the help of our in-depth technical insights comprised of facts, charts and trends.


