

GBP/AUD battles for direction at trendline support
On the four-hour chart, GBP/AUD has been in a three-month uptrend. After failing to post a higher high in February, the pair has developed some bearish momentum. Yesterday's break below the 1.8927 confirmed the completion of a double-top pattern. Currently, GBP/AUD is closing in on the ascending trendline, which is right smack in line with the 200-EMA. In the event that this area can't hold support, a break below the trendline would establish a new downtrend and set the pound up for a potential retest of the lower support area between 1.88 and 1.8780, which is marked at the 38.2% Fibonacci retracement of November's uptrend.
Otherwise, if buyers pay more attention to this crucial support area, we can see the pair pop up above the 200-EMA. If GBP/AUD remains above this hurdle, then it could gain enough momentum to retake 1.8927. further traction would send the price to challenge a key area of interest in a boundary between 1.8960 and 1.8977, which lines up with the falling 50-EMA and the 23.6% Fibonacci retracement.
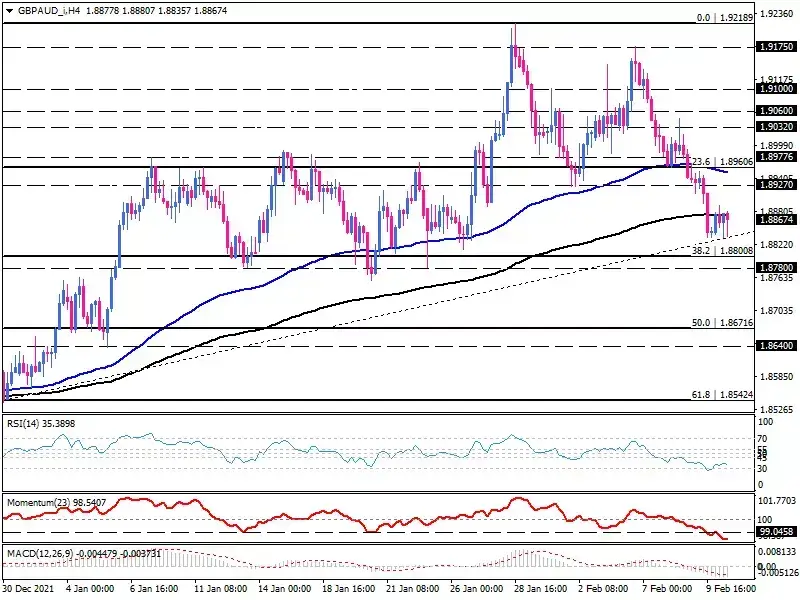
The momentum oscillators are reflecting a bearish bias here. After recovering from oversold territory, RSI is still tending to reach the 30 levels. Momentum is dipping sharply in the selling area. At the same time, MACD bars are pushing downward in the selling zone below the signal line.
Technical Analysis
Discover ideal profit opportunities for your everyday trading with the help of our in-depth technical insights comprised of facts, charts and trends.


