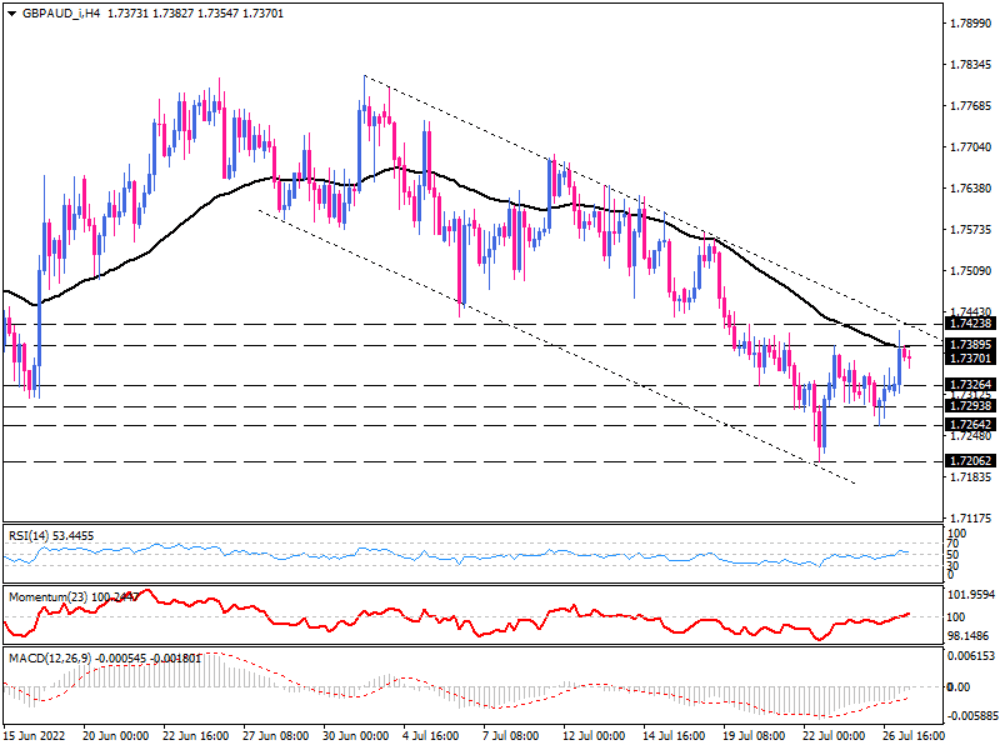
GBP/AUD buyers lost their confidence after hitting a wall of resistance
GBP/AUD is trading in a falling channel on the four-hour chart, while the 50-period EMA is trying to hold resistance. Consequently, the recent rise toward the upper line of the channel coincided with hitting the moving average at around 1.73895, which was the previous market high. A confluence of these obstacles has contributed to the price fall.
In case sellers take cues from the situation, the GBP/AUD is expected to decline further on the back of a stronger Aussie. There is a possibility that the immediate barrier may appear on the way down at the 1.73264 mark as the price drops. If the selling forces are able to overcome this hurdle, they will intensify their efforts to reach 1.73938 as the next target. As more sellers enter the market, the lower support is expected to confront the sell-off at 1.72642 before the price paves its way towards three-month lows around 1.72062.
Alternatively, suppose buyers wish to turn the outlook bullish. In that case, they will need to sustainably surpass the channel's line and break above the confluence of resistances.
Short-term momentum oscillators indicate that the market lacks persistent directional momentum. RSI is hovering around 50-level, hinting at a relative balance between buying and selling forces. Momentum is climbing in the buying area after crossing above its threshold, which implies that bullish sentiment is picking up. Negative MACD bars decrease towards the zero-line, suggesting that selling pressure is out of steam.
To conclude, after hitting a wall of resistance, GBP/AUD is struggling to find a direction.

Technical Analysis
Discover ideal profit opportunities for your everyday trading with the help of our in-depth technical insights comprised of facts, charts and trends.


