GBP/AUD to gain one-week high
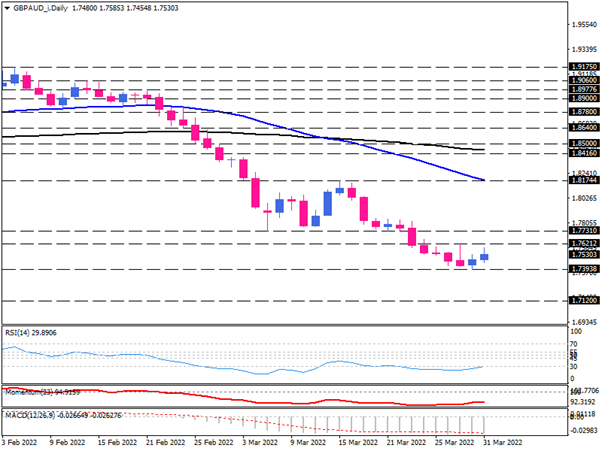
The overall picture of GBP/AUD on the daily chart can be described as bearish. After plunging to 14-month lows near 1.73943, however, the pair has begun to pare some of its losses with buyers attempting to gain towards one-week highs.
It is clear from the daily chart that the overall picture here is bearish, as the 50-day EMA has crossed below the 200-day EMA. It seems like after printing this reverse hammer candlestick here, buyers are trying to reclaim the 1.76212 peak of the week. It is not far after they cross this hurdle that there is immediate resistance from 1.77310. Defeating this barrier may signal contrarian traders to accelerate price appreciation. The price could move towards a 50-day EMA, around the 1.81744 area. In order for the trend to turn bullish, buyers must overcome this barrier.
Suppose. However, the sellers regain control and pierce below the previous bottom at 1.73938. In this scenario, the downtrend will continue with bears targeting the 1.71200 handle.
Momentum oscillators confirm the bearish picture but indicate weakening selling pressure. The RSI will likely appear to diverge in the oversold area. Momentum is heading upwards from its extreme lows in the selling region, and MACD bars are about to cross above the signal line.

Technical Analysis
Discover ideal profit opportunities for your everyday trading with the help of our in-depth technical insights comprised of facts, charts and trends.


