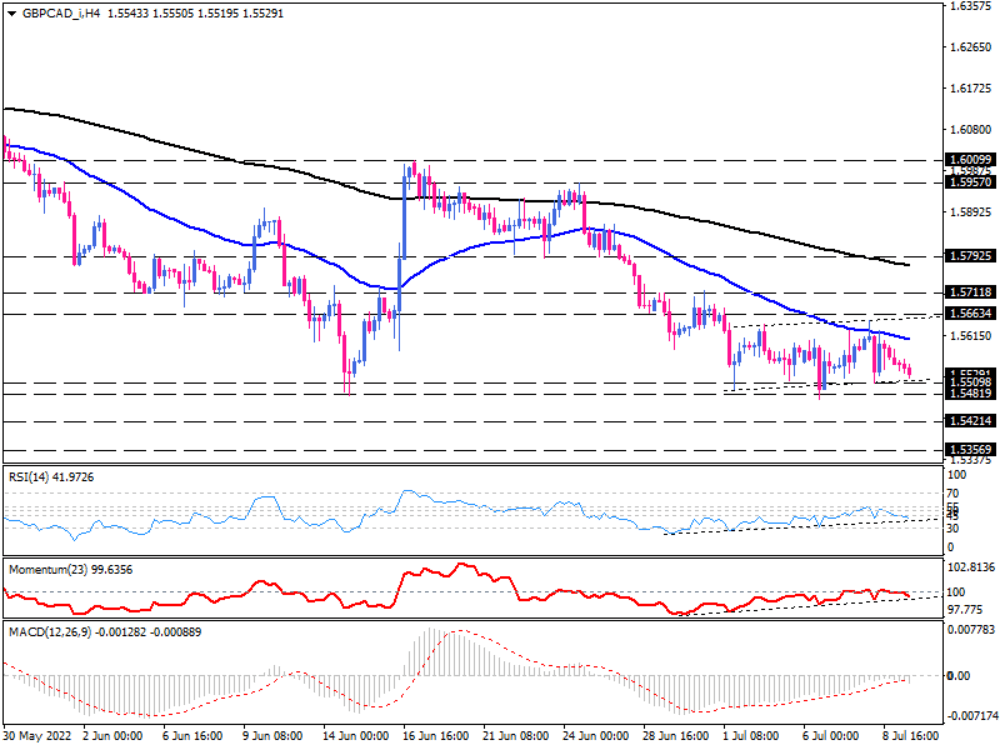
GBP/CAD flag's support to hold back the bear run
On the four-hour chart, GBP/CAD is trading within a flag pattern after falling to its 13-year lows around 1.54819. A prevailing bearish momentum has kept the pair below the 50 and 200 EMAs, with sellers attempting to retest the flag support at 1.55098.
Even though short-term momentum oscillators are trending upward, the lower readings indicate a lack of sufficient buying forces to dominate the market. The RSI and momentum are decreasing towards their upward trendlines after pulling up from their recent extreme points. RSI is recovering from the oversold area. Still, the absence of buyers turned it down before entering the buying region. Likewise, bullish strength was not enough to push momentum above the 100-threshold.
If the market tends to hold the range, prices may pull back from the lower edge of the flag pattern. In that case, GBP buyers will aim for the 50 exponential moving average. Overstepping this hurdle, the pair will extend the rise to hit the 1.56634 dynamic resistance, which lines up with the upper line of the pattern.
Otherwise, sellers will break below 1.55098 as bearish momentum intensifies. A sustained move below this barrier will pave the door to resuming the downtrend, with bears targeting the 1.54819 hurdle around one-month lows. A further decline below this obstacle will put the 1.54214 mark in the spotlight.

Technical Analysis
Discover ideal profit opportunities for your everyday trading with the help of our in-depth technical insights comprised of facts, charts and trends.


