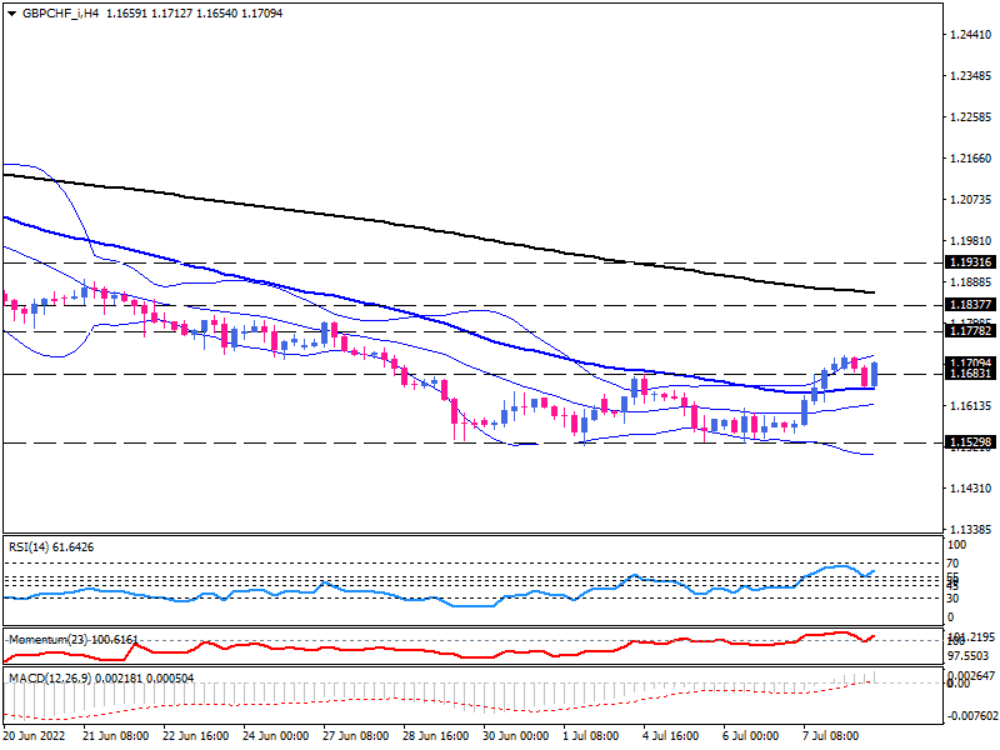
GBP/CHF bulls attempt to reverse the downtrend
A bullish reversal is about to occur on the four-hour chart of GBP/CHF, as sellers have given up after losing their chance to break below the crucial support level of 1.15298. The pair has been in a downtrend, forming lower tops and lower bottoms until bulls crossed above the 50-EMA, tackling the ten-day top at 1.16831, which has placed the market on the upside of the Bollinger bands as well.
Generally, a sustained move above this resistance zone can be seen as a bullish reversal, with the price likely to continue increasing towards the next resistance area at 1.17782. A forceful attempt to overcome this level will bring the 1.18377 barrier into focus, which is in line with the 200-EMA. Crossing this resistance confluence, 1.19316 will serve as the following resistance.
Otherwise, should the market manage to withstand the bull’s pressure, there will be a chance to test the middle band, representing the 20-SMA. Still, sellers need to clear the 1.15298 hurdle to resuming the downtrend.
A convergence of bands with prices circling around the upper band is indicative of accelerating bullish momentum in the market. In addition, RSI is rising in the buying region, and momentum is pointing north above the 100-threshold. After MACD bars have crossed into positive territory, the signal line is also getting close to crossing over the zero line.

Technical Analysis
Discover ideal profit opportunities for your everyday trading with the help of our in-depth technical insights comprised of facts, charts and trends.


