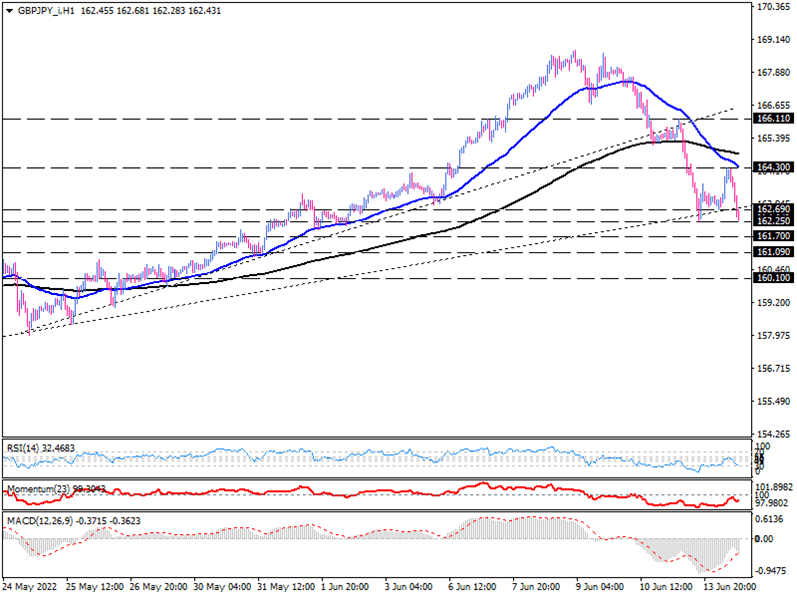
GBP/JPY sellers challenge a key support
On the one-hour chart, GBP/JPY has been trading in a downtrend since forming a double-top reversal pattern on June 10. Because of weak UK data on Monday and Tuesday, the sterling continues to decline, erasing its monthly gains, dropping back to the June 2 lows around the 162.250 mark.
Descending moving averages also exhibit prevailing bearish bias as 50 EMA crossed below the 200 EMA, followed by a break of the day low at 162.690. recent down movement can lead to a further decline towards the key support at 162.250. in the event that selling forces intensify, breach of this barrier may result in penetration of the ascending trendline, then 161.700 can prove to be the next barrier. Having this level cleared, sellers can get to the 161.090 hurdle. If sellers dominate below this obstacle, the next support can develop around the 160.100 mark.
Alternatively, if the trendline holds anyway, buyers may return to the market, aiming for the previous top at around 164.300, which lines up with the 50-EMA. Overstepping this confluence of resistances can brace the price for challenging the 200-EMA.
Short-term momentum oscillators imply bearish momentum. RSI is hovering in the selling area below its 50-baseline. Momentum has also printed a reading below the 100-threshold in the bearish zone. Likewise, negative MACD bars are attempting to cross the signal line downside.
However, a clear signal will emerge when we see a sustained break below the rising trendline, in conjunction with clearing the market bottom of 162.250.

Technical Analysis
Discover ideal profit opportunities for your everyday trading with the help of our in-depth technical insights comprised of facts, charts and trends.


