GBP/USD upside bias is fading
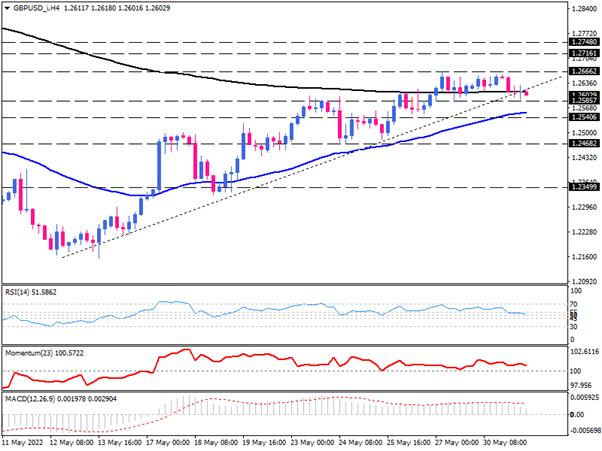
GBP/USD pair has been trading in an uptrend on the 4-hour chart since May 17. Buyers have been able to pass the price above the 50 and 200 exponential moving averages by forming higher tops and higher bottoms. However, after a two-week rally, the uptrend seems to have faded, and buyers are out of breath against the 1.26662 hurdle.
The pound is currently hovering within a range between the 1.26662 ceiling and the 1.25857 floor. Breaking through this range will indicate the next price direction. As we see on the chart, buyers attempt to keep the uptrend line intact and hold the price above the 200 moving average. In the event they succeed in reviving the uptrend by breaking the price above the 1.26662 mark, the uptrend may extend to the 1.27161 barrier. A sustained move above this barrier will draw market attention to the resistance level of 1.27480.
Otherwise, if sellers retake control, we can expect the support of 1.25857 to be broken. Further decline could lower the price towards the 50 EMA, around 1.25406. A move below this dynamic support encourages more sellers to join the market aiming for the 1.24682 hurdle.
Looking at short-term momentum oscillators also shows that buyers' power has declined. As we can see, the RSI has entered the neutral zone by falling from the overbought territory. In addition, momentum has created a clear divergence against the price higher tops, indicating the weakening buyers' pressure in the market. MACD bars are also declining to zero as they move down in the positive region below the signal line.

Technical Analysis
Discover ideal profit opportunities for your everyday trading with the help of our in-depth technical insights comprised of facts, charts and trends.


