

Gold bears attempt to break the range
The gold price is struggling to find direction amid the hawkish Fed's outlook and the Russia-Ukraine standoff. The precious metal has been oscillating in a narrow range this week, awaiting a decisive break either way. Jerome Powell remains confident about the US economy, backing a rate hike of 50bps in May. The Fed's aggressive plans to tighten have driven US Treasury yields through the roof, limiting gold's upward movement. While Russian hostilities continue against Ukraine and peace talks remain deadlocked, gold's downside is tempered.
Technical view
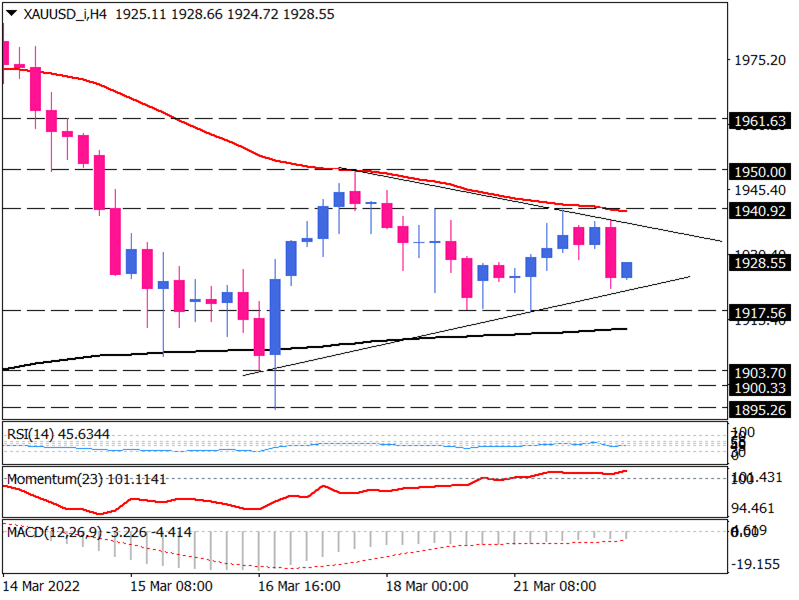
On the 4-hour chart, we can see the precious metal is consolidating in a range between converging 50 and 200 EMAs. The market is trendless now. However, In the opening of the European trading session, the bearish sentiment is prevailing with the price approaching the range support clustered with 1917 barrier and 200 exponential moving average. The reaction to this hurdle will be crucial to clear the subsequent direction of the price. Holding below 200-EMA would be a convincing indication of a clear bearish outlook for more sellers. A sustained move below this level can set the stage for further decline towards the area between 1903 and 1895 marks, which has been tested earlier in the mid-March. In case this region fails to draw the attention of buyers, the sellers may overcome, pushing prices down to a lower support level around 1880.
If we take the opposite tack and suppose buyers defend the prior bottom at 1917 in order to hold gold in the range, the subsequent resistance will come from the 50-EMA around 1940. In the event that there is a break above this latter, more buyers will take a cue of upside breakout to recapture the 1950 handle. Defeating this roadblock will confirm the upside breakout, paving the way towards 1961 as the next resistance.
Momentum oscillators reflect a mixed picture as the price is rangebound. The RSI is pulling out of the neutral zone into the selling area. However, momentum is hovering above the 100-threshold with no clear directional indication. Negative MACD bars are also flattening below the signal line.
Technical Analysis
Discover ideal profit opportunities for your everyday trading with the help of our in-depth technical insights comprised of facts, charts and trends.


