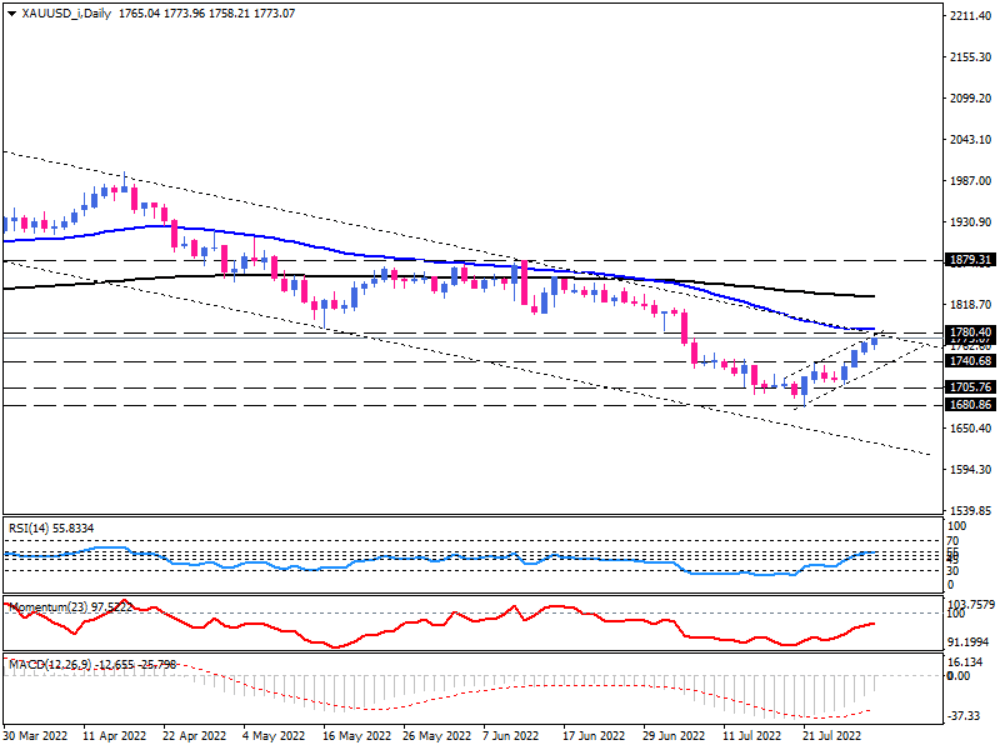
Gold is headed towards a key resistance confluence
While the weaker dollar has given more room to gold to pull up from its one-year bottom at $1680, price action indicates that the precious metal is approaching a crucial resistance zone.
Gold has been trading in a descending channel since early March. It is up for the fourth consecutive day after bottoming at $1680. Buyers are trying to push the price higher towards the 1780 mark. This level of interest is in line with the 50-day exponential moving average, coinciding with the falling channel’s resistance. If this confluence of resistances can hold, the rally may be halted, with sellers gaining momentum to drag the price lower towards $1740. A further decline below this barrier will put the 1705 hurdle into the spotlight. By overcoming this obstacle, sellers will turn their attention to the record-low of $1680 before eyeing the channel’s support line.
Alternatively, should less hawkish Fed expectations and recession fears continue to grow, we can see an upside breakout of the falling channel, which will push the price above the 50-day EMA, paving the way towards the 200-EMA. In the event that bulls manage to clear the 200-day EMA, the outlook will turn bullish, and 1879 will be the following resistance to confront the upside movement.
Short-term momentum oscillators imply a mixed picture. RSI is moving higher at the upper border of the neutral zone. While momentum is hovering in the selling area and MACD bars are in negative territory, indicating waning bearish bias is still prevalent.

Technical Analysis
Discover ideal profit opportunities for your everyday trading with the help of our in-depth technical insights comprised of facts, charts and trends.


