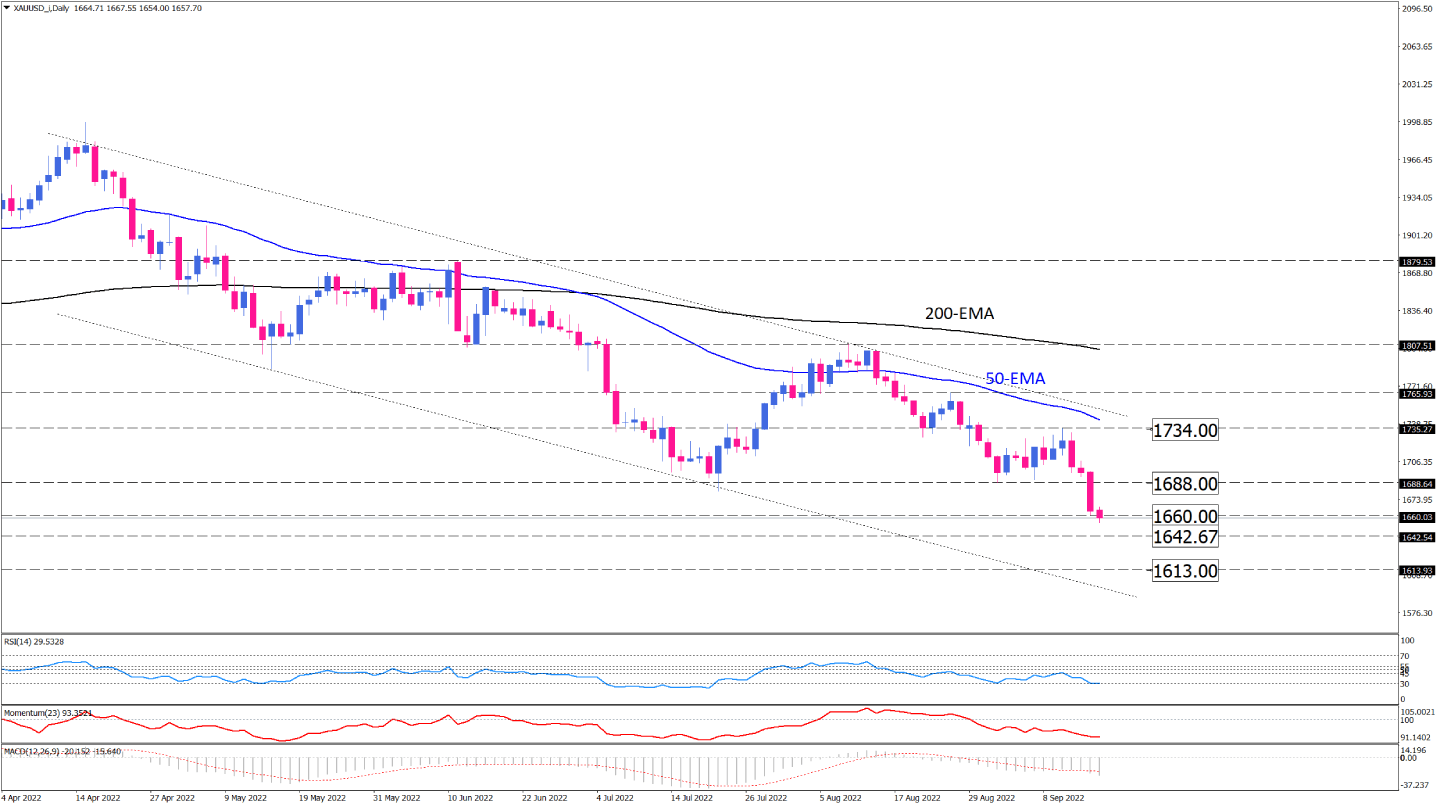
Gold sellers dominate the market below the multi-year bottom
On the daily chart, gold has been trading downward since mid-April in a descending channel. Selling pressures intensified last night, getting the price below the crucial $1688 support level for the first time in two years. The precious metal is hanging out at $1660 on Friday morning session, and a decisive break of this level will pave the way toward $1642. If sellers beat this hurdle, the market will keep an eye out for further downside action that can take gold to $1613. Gold bears can take advantage of the current bearish momentum to drag the gold down to the channel’s lower line.
Otherwise, a clear break above the $1688 former support may keep bulls hopeful for reaching the 50-EMA again, while only a decisive breach above the channel can reverse the outlook.
The 50-EMA is below the 200-EMA, and the gap between the moving averages has widened to hint at accelerating bearish momentum. Short-term momentum oscillators imply a dominant bearish bias. However, RSI has hit its selling extreme at 30, suggesting no more room for sellers. But, momentum is trending down in the selling region, and the MACD histogram succeeded in crossing below the signal line in the negative zone.

Technical Analysis
Discover ideal profit opportunities for your everyday trading with the help of our in-depth technical insights comprised of facts, charts and trends.


