

S&P500 bearish bias remains despite daily traction
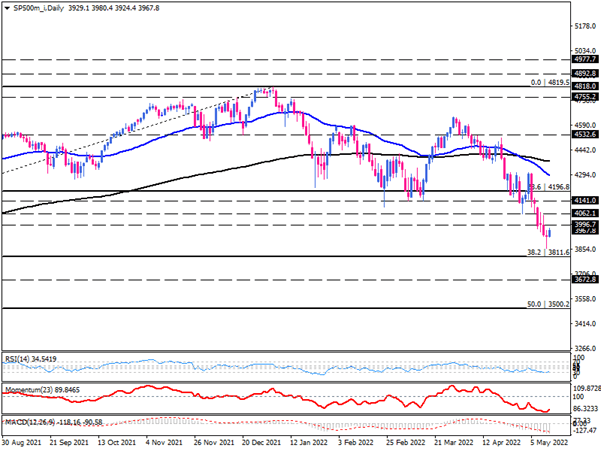
On the daily chart, the S&P500 index is still retreating from the historical peak of 4819.5, which was reached in January. As we can see, stock markets have had a challenging year so far in 2022, and this index has fallen by more than %35 so far. Another sign of a prevailing downtrend is the 50-day EMA crossing below the 200-day EMA early in May. Even though buyers stepped in on Friday to raise the price to 3980, as long as the price moves below the moving averages, making lower tops and lower bottoms, the outlook is bearish.
For the bears, the immediate key support is seen at 3811.6, which lines up with the 38.2% Fibonacci level. In case the downtrend continues, and sellers manage to push the price down, then the decline will continue towards the next support level at 3672.8. If this level cannot provide sufficient support to the price, sellers will be prepared to target 3500.2, aligning with the 50% correction of the prior uptrend.
Alternatively, a bullish correction might take the price to the 3996.7 and 4062.1 resistance levels. If each of these price levels can successfully halt the rally, sellers will consider that an opportunity to reenter the market
Short-term momentum oscillators indicate a bearish bias. The RSI fluctuates near the 30 range in the selling area. The momentum is also below the 100 baseline, which is an indication of selling pressure. Similarly, MACD bars in the negative region are advancing below the signal line.
Technical Analysis
Discover ideal profit opportunities for your everyday trading with the help of our in-depth technical insights comprised of facts, charts and trends.


