S&P500 buyers attempt to keep the price above the 50-day EMA
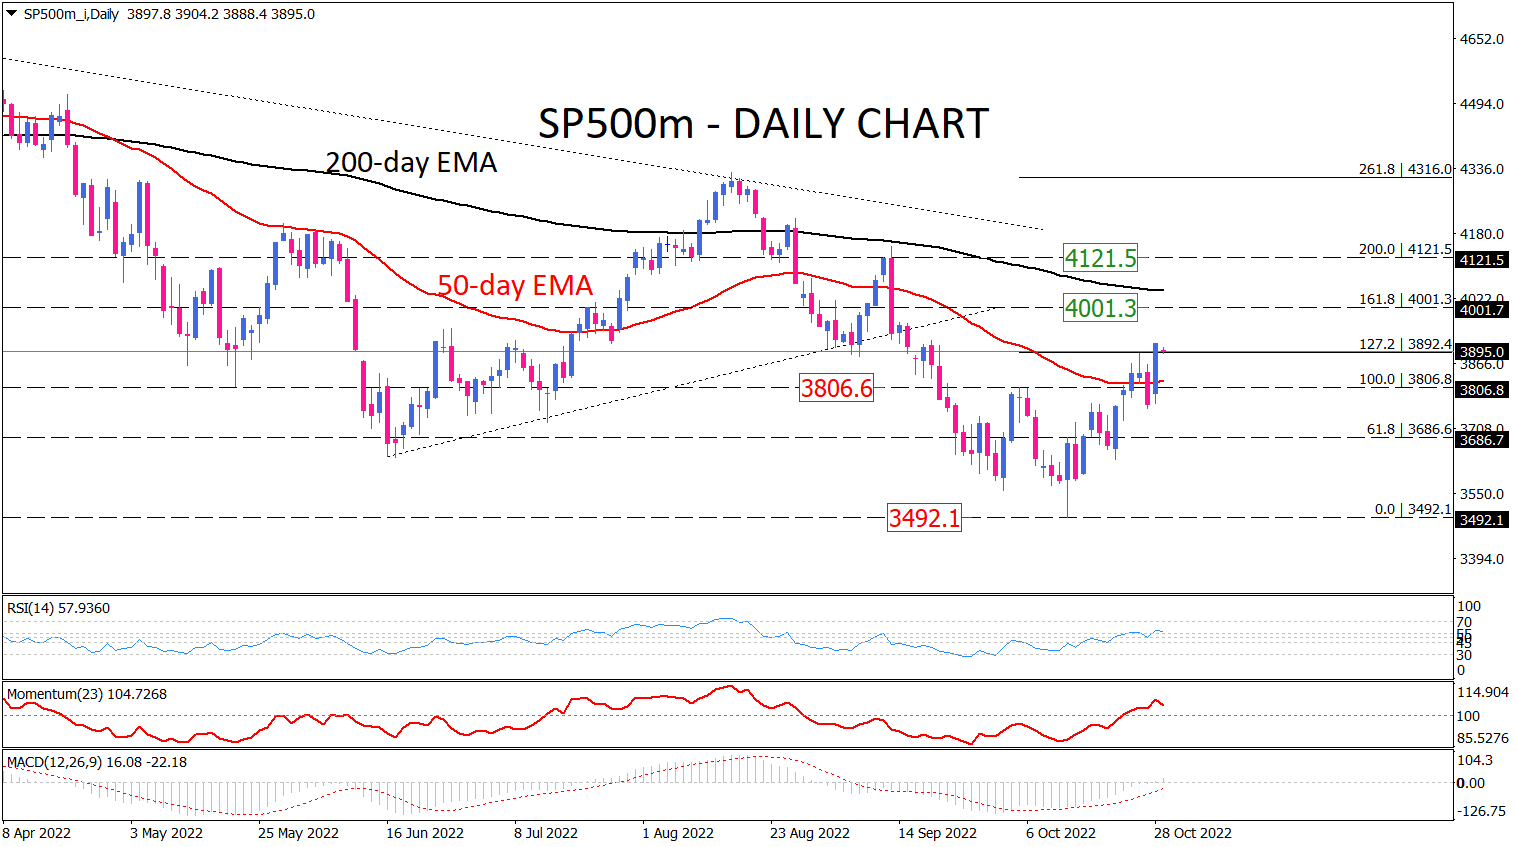
As seen on the daily chart, the upside momentum in the S&P500 futures index is picking up after closing the last week on a positive note, with buyers pulling up the price above the 50-day EMA. The move also confirmed the completion of a double-bottom pattern, which has resulted from facing the 3492.1 price floor on October 3 and October 13. Having the neckline at 3806.8 broken while the index is in a primary downtrend keeps bulls hopeful about extending the rally to retest the falling trendline, located at the 200-day exponential moving average around the 4001.3 psychological level.
Otherwise, should sellers be back on the ground, intensifying bearish sentiment can bring the price all way down below the 50-day EMA support level. The further decline will put 3686.6 on the seller’s radar.
Short-term momentum oscillators support the fact that sellers have retreated from the market, giving more headroom to the price. RSI is trending upward in the buying region. Momentum is also moving higher above the 100-threshold. Likewise, MACD bars crossed over zero and the rising signal line is following the same path, which means buyers are taking control of the market.

Technical Analysis
Discover ideal profit opportunities for your everyday trading with the help of our in-depth technical insights comprised of facts, charts and trends.


