

S&P500 consolidates as positive momentum waned
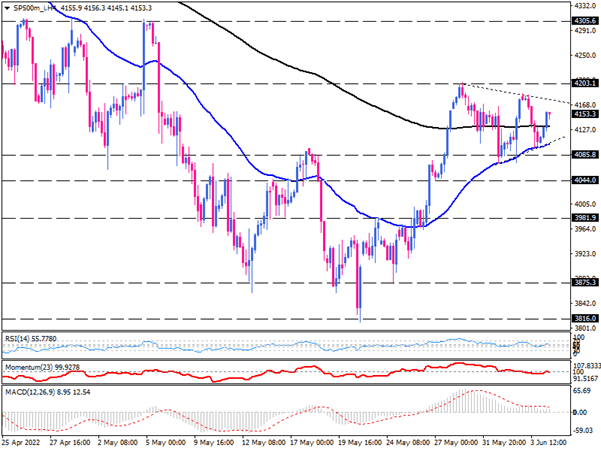
The S&P500 index in the 4-hour time frame dropped to 3816 after retreating from the 4940 peak. As buyers found prices at this attractive level, the formation of a double-bottom reversal pattern reflected an increase in their desire to drive prices higher. On May 27, the pattern neckline was broken, ending the downtrend. But prices have been squeezing within a neutral range since then. Investors appear to be waiting for the next Fed meeting, which could lead to higher interest rates.
Currently, the index forms a symmetrical triangle pattern. After a pullback from the 50-exponential moving average, it is climbing to the ceiling of this pattern. This critical dynamic resistance may deter buyers for the third time. The converging 50 and 200 moving averages are another sign of sideways. Buyers must cross the key 4200 barrier to resuming the uptrend. The price can climb to $4305 if this hurdle is cleared. It is likely that, in the event the buying force strengthens, the break of this resistance could send the index to 4517, which is the April 21 high.
But robust employment data last week suggests that the Federal Reserve will likely continue its contractionary policies, and a 50-point interest rate hike next week may push stocks out of investors' hands. Consequently, the sell-off may intensify again, and the price may return to the 50 EMA near the lower line of the pattern. If sellers cross this barrier, the S & P500 index outlook will decline. The price decline can continue up to 4044 and 3981. Momentum oscillators show buyers' power has decreased after entering the triangle and warn that the index ascent has halted.
There are fluctuations in the RSI at the edge of the neutral zone and the buying range. Momentum around the 100-line doesn't exhibit any directional movement. MACD bars are also shrinking to zero. And the signal line is flattening out.
Technical Analysis
Discover ideal profit opportunities for your everyday trading with the help of our in-depth technical insights comprised of facts, charts and trends.


