S&P500 is set to hit three-week lows
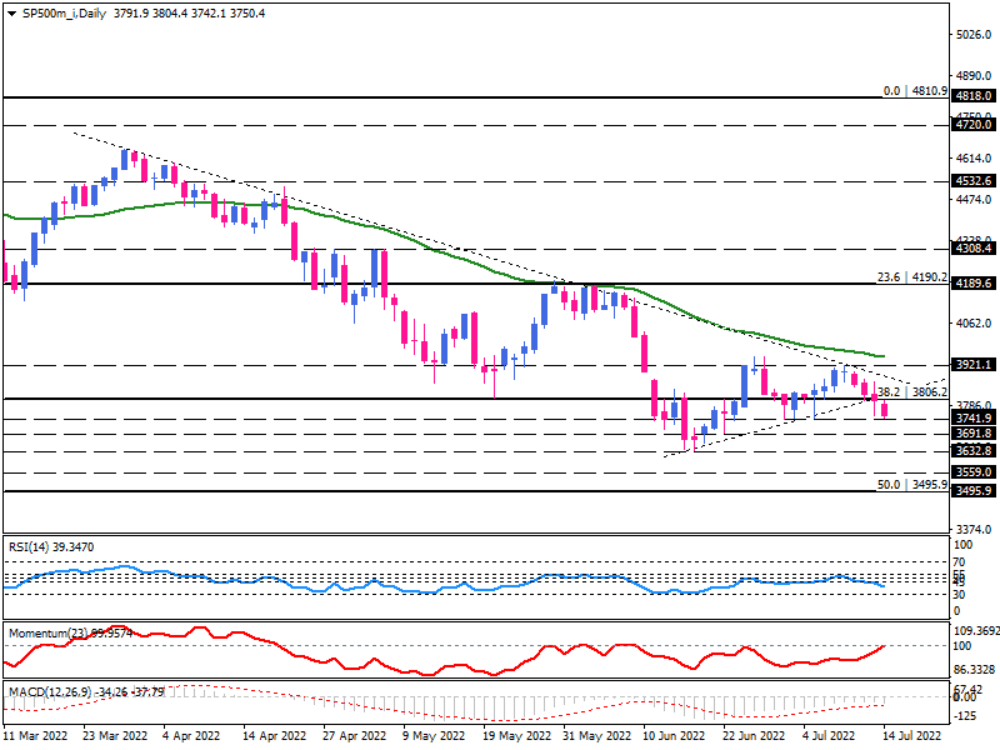
Another hot reading of inflation put more pressure on the stock markets as all major indices in the US continue to fall. S&P500 also entered its fourth day in red on Thursday, with sellers targeting the three-week low of 3741.9.
The index has been in a downtrend since March 2022 on the daily chart. However, speculating about a less hawkish Fed had kept the index in a consolidation pattern until recent inflation data on Wednesday made it clear that more rate hikes should be on the cards. This prompted a new sell-off across equities, resulting in the violation of the recent ascending triangle pattern. As a result, bears have regained control, and the index is headed towards the 3741.9 mark.
Suppose intensifying selling pressure contributes to a decisive break of this hurdle. In that case, the further decline may be assumed imminent with a target of 3691.8. overcoming this support can then pave the door towards 3632.8, the lowest level since December 2020.
If sellers take a clue from further slowdown expectations because of another hefty interest rate increase by Federal Reserve, they may clear this barrier and put the support area between 3559 - 3495 in the spotlight. Such a move can result in a 50% correction of the post-pandemic recovery.
Otherwise, the bulls need to pull up the index towards the 3921.1 previous top to stay in the play. If buyers wish to turn the trend bullish, they must break above the resistance confluence of this market top and the 50-day EMA.
Short-term momentum oscillators reflect the general bearish tendency. RSI points down in the selling region and shows enough room to extend the downswing further. Momentum is about to hit the 100-threshold, which may result in a bounce back to hint at substantial bearish strength.

Technical Analysis
Discover ideal profit opportunities for your everyday trading with the help of our in-depth technical insights comprised of facts, charts and trends.


