

The 200-day EMA capped ripple cruising
On the daily chart, ripple has been forming lower highs since November 2021. The penetration of the falling trendline gave bulls hope that the trend might be reversed. Nevertheless, the 200-day EMA limits further cruising by providing strong resistance.
Ripple is struggling with the 200-day EMA
We have seen many failed attempts to break above this hurdle in recent weeks as the pair is consolidating in the 200 and 50-day EMAs boundary. Buyers need a sustained move above the 200-day EMA to reconquer the previous top at 0.9119. clearing this barrier would establish an uptrend and encourage more buyers to rein the market. If bullish momentum persists, they will keep their eyes on the psychological level of 1 dollar. Otherwise, consolidation will keep rolling out if the slow EMA holds resistance, sending the price towards the 50-day EMA in line with 0.7584.
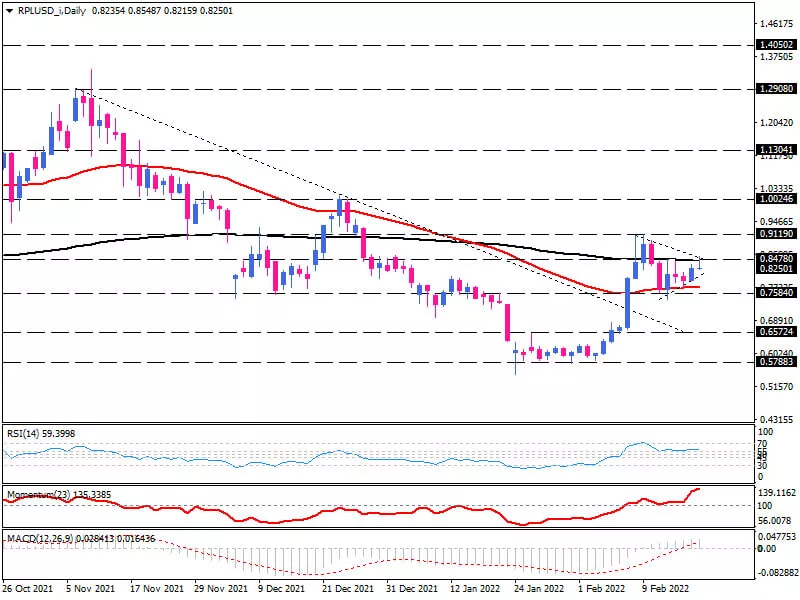
Short-term oscillators support a bullish bias. RSI is hovering in the buying region, and momentum is rising sharply above the 100-threshold. In addition, the MACD bars are climbing above the zero line, while the signal line has crossed above the zero line as well.
Bulls drive higher in the short-term consolidation pattern
On the four-hour chart, ripple has been stuck in a consolidation pattern. Currently, buyers attempt to reach this dynamic resistance on the top, which aligns with the previous top at 0.8478. a sustained break above this hurdle would pave the door towards an upward movement. If that's the case, the next resistances are expected to appear at 0.8678 and 0.8805. If buyers overcome these levels, prevailing bullish momentum will put 0.8933 in the spotlight, in line with the 161.8% Fibonacci level.
On the flip side, if bearish sentiment accelerates, the price may drop to the pattern bottom along with the 50-EMA. A further decline below this support area can lead to touching the swing bottom at 0.7741. A sustained move below this barrier would put the 200-EMA in the vicinity of the 0.7584 barricade on sellers' radar.
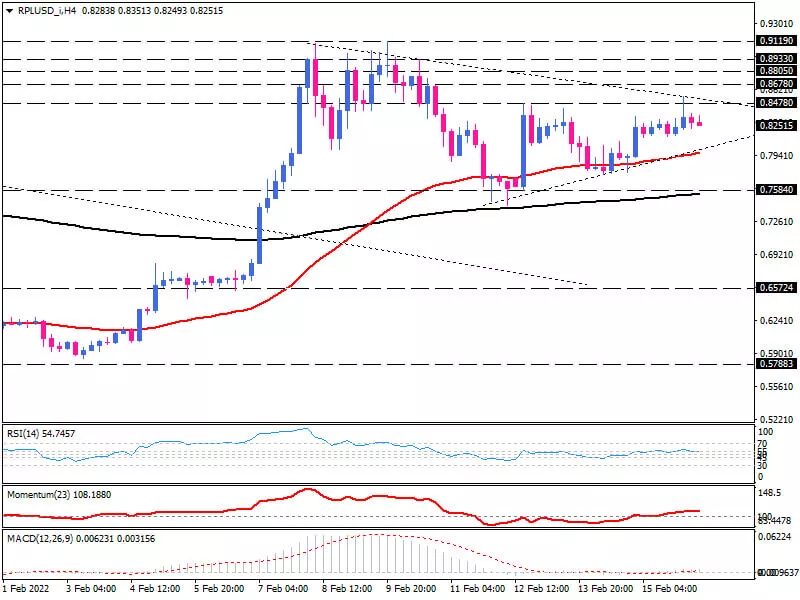
Momentum oscillators are reflecting bullish momentum. RSI is trending up in the buying territory as well as rising momentum. MACD bars are increasing in the positive region above the signal line.
Technical Analysis
Discover ideal profit opportunities for your everyday trading with the help of our in-depth technical insights comprised of facts, charts and trends.


