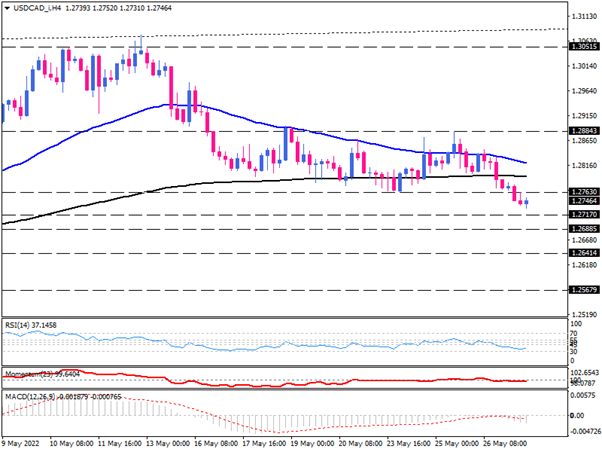
USD/CAD extends losses below its weekly low
After some rangebound between converging EMAs, USD/CAD on the four-hour chart has portraited a bearish outlook with the price breaking below the week’s low at the 1.27630 mark. Seemingly, as the US dollar keeps its retracement from its 20-year peak in light of the less hawkish Fed, traders are more attracted to the Loonie on the back of rising oil prices.
If sellers successfully extend the down move, the immediate support can come from the 1.27170 mark. In the event that they overcome this barrier, the price may continue to decline towards its one-month low around the 1.26885 hurdle. Suppose intensifying bearish momentum results in a decisive break below this barricade. In that case, sellers will turn their attention to the 1.26414 mark.
Otherwise, if USD buyers return to their seats and retake control, Loonie may claim the ground above the 1.27630 broken support level, which has turned to resistance. A sustained move above this hurdle can fuel the price to reach the 200-EMA. The pair may continue sideways unless it breaks above the crucial resistance of 1.28843, which will trigger a buy signal.
Short-term momentum oscillators imply bearish bias. RSI is moving downward in the selling region near the 30 level. Likewise, momentum is delving below the 100-threshold in bearish territory. At the same time, MACD bars are dipping in the negative area below the descending signal line.

Technical Analysis
Discover ideal profit opportunities for your everyday trading with the help of our in-depth technical insights comprised of facts, charts and trends.


