USD/CHF sellers are about to reverse the trend
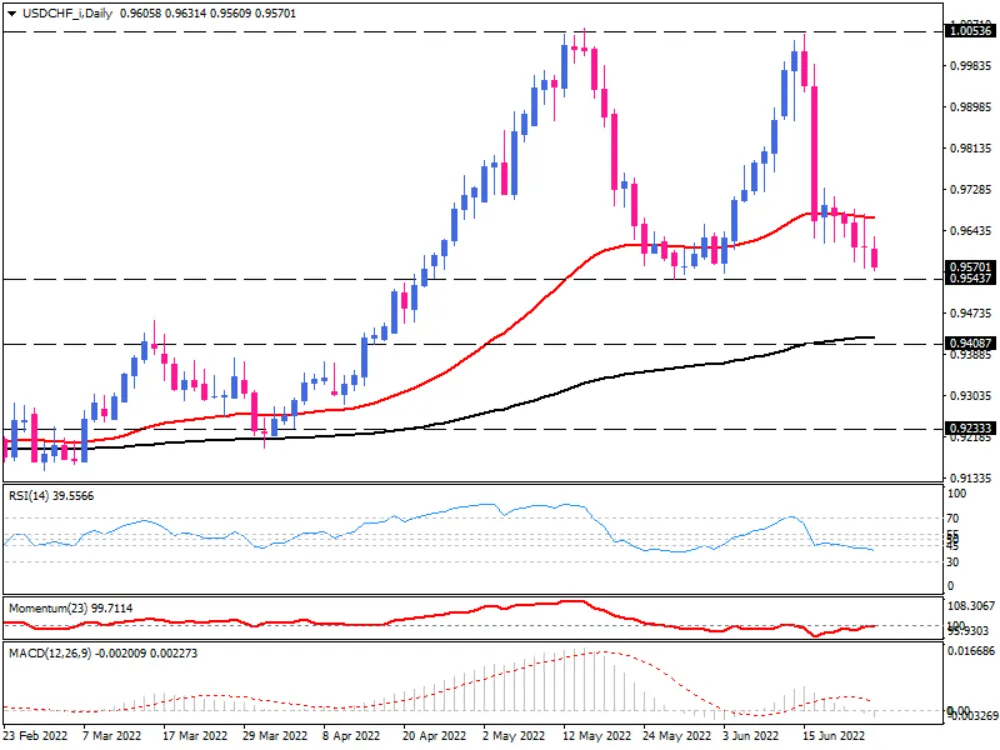
On the daily chart, USD/CHF has been experiencing a massive sell-off in recent days. The pair is headed for a fifth consecutive day in red territory, with sellers drawing a new weekly low on Friday. Moreover, topping around 1.00536 on June 15 has formed a double-top pattern waiting to be confirmed by breaking below the neckline at 0.95437.
In the event that bears manage to overcome this hurdle, the price could tumble by the same height as the reversal pattern. This is the projection measurement of the pattern. Before then, however, immediate support can potentially confront the downtrend around the 0.94064 mark, coinciding with the 200-day exponential moving average. If this barrier fails to stall the fall, that will take the USD/CHF down to the 0.92317 barricade.
Otherwise, if buyers step in to keep the 0.95437 support level intact, the price can back up towards the 50-day EMA again, which lines up with the 0.96517 mark.
These short-term momentum oscillators point in the direction of sellers. RSI is moving downward in the selling area. Momentum is also hovering below the 100-baseline, implying overall bearish sentiment in the market. Likewise, MACD bars have triggered a bearish signal by crossing below the zero-line.

Technical Analysis
Discover ideal profit opportunities for your everyday trading with the help of our in-depth technical insights comprised of facts, charts and trends.


