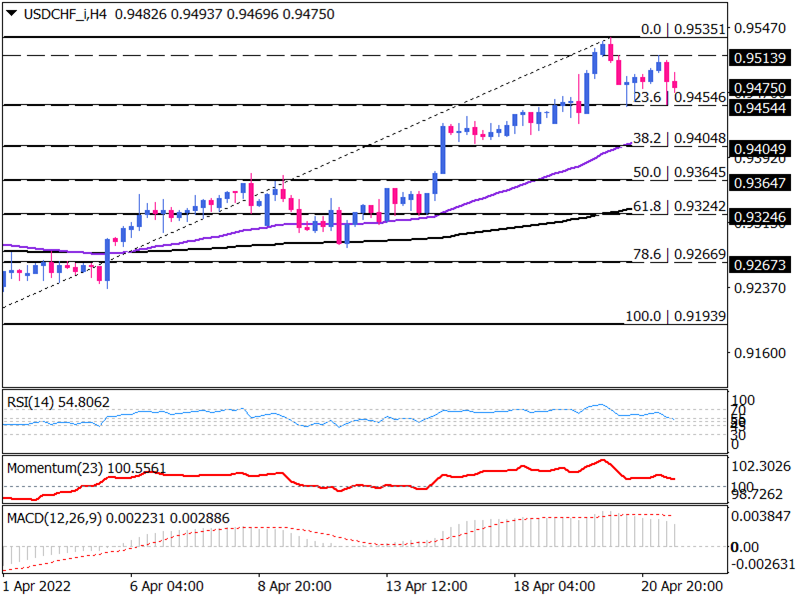
USDCHF uptrend getting out of steam
As the four-hour chart shows, the pair has been in an uptrend since early March, trading above the 50 and 200 exponential moving averages. However, after topping at 0.95351 around an almost two-year high, the momentum is getting out of steam, with buyers retreating towards the 23.6% Fibonacci retracement of this one-month uptrend. Yet we need more from price action to get directional evidence as the price is consolidating between 0.95139 and 0.94546.
Suppose the market closes lower than the previous candle’s low; Tuesday’s high would prove to be a new lower top. In that case, the support level of 0.94546 would come into the spotlight. If sellers gather enough strength to break this hurdle, there would be a completion of a failure swing reversal pattern, leading to further decline towards the 50-EMA. And in the case that this support can’t hinder the emerging downtrend, the 38.2% Fibonacci level around 0.94048 is expected to offer help in the short term.
Otherwise, if buyers make traction exceed the 0.95139 USDCHF will continue rangebound and confirmation of resuming uptrend comes only if they break above the previous top at 0.95351.
Momentum oscillators reflect fading bullish momentum. RSI pulling off the overbought region towards the neutral zone. Momentum is falling into buying territory towards the 100-baseline, and positive MACD bars are shrinking towards the zero line. All are conveying bulls are taking a breather right now.

Technical Analysis
Discover ideal profit opportunities for your everyday trading with the help of our in-depth technical insights comprised of facts, charts and trends.


