USD/JPY buyers face solid 10-year resistance
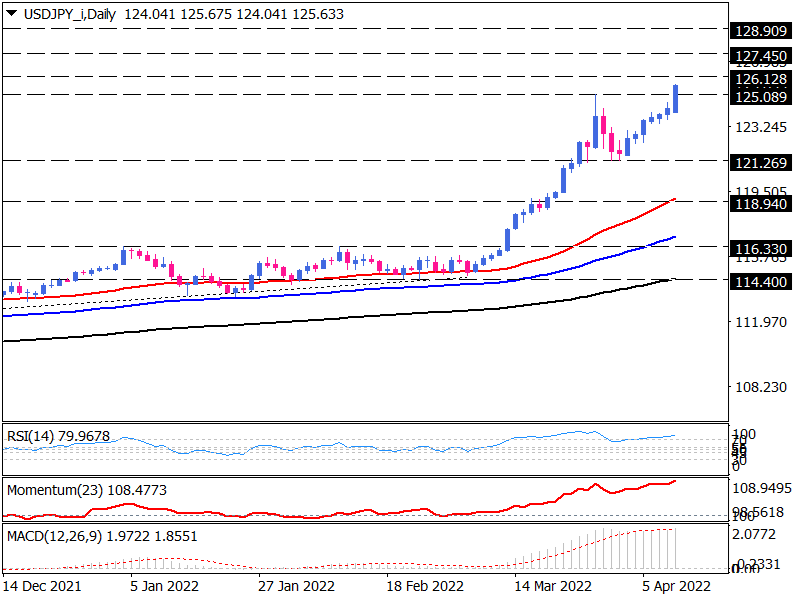
On the daily chart, USD/JPY started its rally after a sideways period from November to early March. Currently, the yen continues to decline against the dollar after hitting a support level at 121.269, with the USD/JPY pair trading above the 125.089 peak.
Since the price has been at this level only once since 2002 and has not been able to cross it, we may see some price consolidation around this solid resistance.
However, suppose buyers succeed in closing the price above this crucial level. In that case, the next resistance area at 126.128 will be in the spotlight. Breaking this barrier will pave the way for the rally to continue to 127.450, which aligns with the 161.8% extension of the previous corrective swing.
Otherwise, if sellers can maintain this 10-year resistance, another correction will occur that could move the pair to the short-term support area around 124.272. Breaking this barrier will encourage more bears to meet 123.630 at the 61.8% Fibonacci level. However, they may end the rally in the short term only if they break below the support area of 121.269.

Short-term momentum oscillators imply the complete dominance of buyers, indicating that an uptrend is eroding, and the rally may cease for some time. The RSI is in the overbought region and is rising to its previous high. Momentum is rapidly rising in the buying area. Likewise, the MACD histogram has crossed the signal line upside after a period of flattening in positive territory.
Technical Analysis
Discover ideal profit opportunities for your everyday trading with the help of our in-depth technical insights comprised of facts, charts and trends.


