
Australian Dollar moves sideways amid market caution ahead of US NFP
- The Australian Dollar remains steady ahead of the US Nonfarm Payrolls release on Friday.
- The AUD receives support from easing concerns of the US-China trade situation.
- US Initial Jobless Claims rose to 219K the previous week, against the expected 213K and 208K prior.
The Australian Dollar (AUD) consolidates against the US Dollar (USD) on Friday. However, the AUD/USD pair received upward support amid easing US-China trade tensions as US President Donald Trump and Chinese President Xi Jinping are set to discuss potential tariff rollbacks.
China, Australia’s key trading partner, retaliated against the new 10% US tariff that took effect on Tuesday. However, on Monday afternoon, US President Donald Trump stated that he would likely speak with China within 24 hours. Trump also warned, “If we can't reach a deal with China, the tariffs will be very, very substantial.” Despite this, no further updates have emerged.
Markets now place a 95% probability of a Reserve Bank of Australia (RBA) rate cut from 4.35% to 4.10% in February, weakening the AUD’s resilience. The RBA has kept the Official Cash Rate (OCR) at 4.35% since November 2023, emphasizing that inflation must “sustainably” return to its 2%-3% target range before considering any policy easing.
Australian Dollar could decline amid market caution ahead of US jobs report
- The US Dollar Index (DXY), which measures the US Dollar’s value against six major currencies, rises to near 107.70 at the time of writing. The Greenback could receive support as sentiment turns cautious ahead of a key US jobs report. Traders brace for Friday’s US Nonfarm Payrolls (NFP) data, which is expected to shape the Federal Reserve’s (Fed) monetary policy direction.
- US Initial Jobless Claims rose to 219K for the week ending January 31, as reported by the US Department of Labor (DoL) on Thursday. This print surpasses initial estimates of 213K and was higher than the previous week's revised tally of 208K (from 207K).
- The US ISM Services PMI eased to 52.8 in January from 54.0 (revised from 54.1) in December. This reading came in below the market consensus of 54.3.
- Federal Reserve Bank of Dallas President Lorie Logan made headlines late Thursday, stating that while progress on inflation has been significant, the US labor market remains too strong for the Fed to consider rate cuts in the near future. Logan also acknowledged that even if inflation reaches the 2% target, it may not be sufficient on its own to prompt a rate reduction.
- On Thursday, Federal Reserve Vice Chair Philip Jefferson expressed his satisfaction with keeping the Federal Funds Rate at its current level, stating that he would assess the overall impact of Trump's policies before making further decisions. He also emphasized that the Fed's rate remains restrictive for the economy, even with a 100-basis-point decline.
- President Trump has agreed to a 30-day suspension of the proposed 25% tariffs on Canadian and Mexican imports. This decision comes after Canadian Prime Minister Justin Trudeau and Mexican President Claudia Sheinbaum committed to enhancing border security measures to address concerns over illegal immigration and drug trafficking.
- China’s Commerce Ministry announced that it will impose a 15% tariff on US coal and liquefied natural gas (LNG) imports, along with an additional 10% tariff on crude Oil, farm equipment, and certain automobiles. Additionally, to "safeguard national security interests," China is implementing export controls on tungsten, tellurium, ruthenium, molybdenum, and related products.
- Australia's trade surplus fell to 5,085M in December, missing the expected 7,000M and down from the previous surplus of 6,792M. Exports increased by 1.1% MoM, slowing from November's 4.2% rise, while imports surged 5.9% MoM, up from 1.4% in the prior month.
- Australia’s Judo Bank Composite PMI climbed to 51.1 in January from 50.2 in December, reflecting modest growth in private sector activity. Meanwhile, the Judo Bank Services PMI rose to 51.2 from 50.8, marking the twelfth consecutive month of expansion in the services sector. Although growth was moderate, it was the strongest since August.
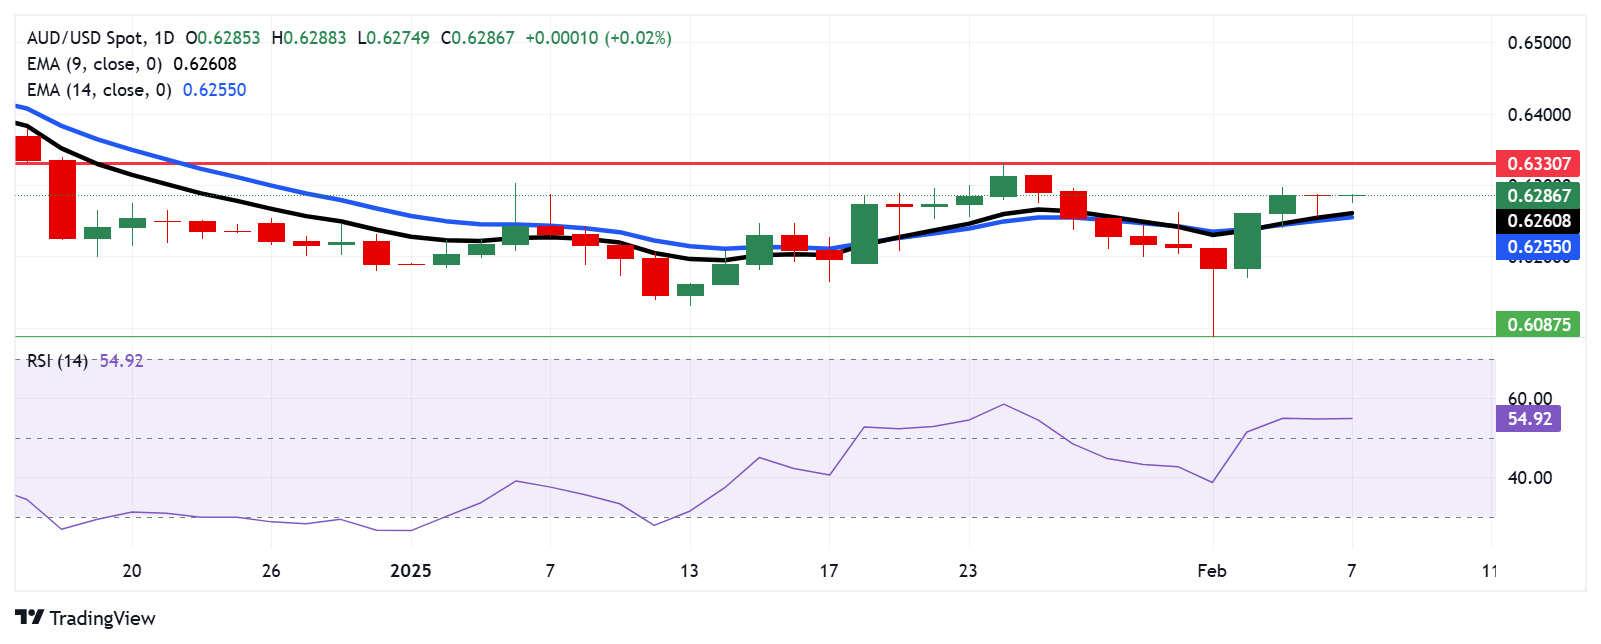
Australian Dollar remains steady below 0.6300, initial support appears at nine-day EMA
AUD/USD hovers near 0.6290 on Friday, maintaining its position above the nine- and 14-day Exponential Moving Averages (EMAs) on the daily chart, signaling stronger short-term bullish momentum. Additionally, the 14-day Relative Strength Index (RSI) remains above the 50 level, reinforcing the bullish trend.
On the upside, the AUD/USD pair could test the seven-week high of 0.6330, last reached on January 24.
Immediate support lies at the nine-day EMA near 0.6260, followed by the 14-day EMA at 0.6254. A break below these levels could weaken the bullish outlook, potentially driving the AUD/USD pair toward 0.6087—the lowest level since April 2020, which was recorded on February 3.
AUD/USD: Daily Chart
(This story was corrected on February 7 at 03:00 GMT to say, in the first bullet, the US Nonfarm Payrolls release on Friday, not Thursday.)
Australian Dollar PRICE Today
The table below shows the percentage change of Australian Dollar (AUD) against listed major currencies today. Australian Dollar was the weakest against the New Zealand Dollar.
| USD | EUR | GBP | JPY | CAD | AUD | NZD | CHF | |
|---|---|---|---|---|---|---|---|---|
| USD | 0.08% | 0.11% | 0.03% | 0.11% | 0.02% | -0.02% | 0.16% | |
| EUR | -0.08% | 0.03% | -0.06% | 0.03% | -0.08% | -0.10% | 0.07% | |
| GBP | -0.11% | -0.03% | -0.09% | -0.00% | -0.10% | -0.13% | 0.05% | |
| JPY | -0.03% | 0.06% | 0.09% | 0.08% | -0.02% | -0.08% | 0.11% | |
| CAD | -0.11% | -0.03% | 0.00% | -0.08% | -0.10% | -0.13% | 0.05% | |
| AUD | -0.02% | 0.08% | 0.10% | 0.02% | 0.10% | -0.04% | 0.15% | |
| NZD | 0.02% | 0.10% | 0.13% | 0.08% | 0.13% | 0.04% | 0.18% | |
| CHF | -0.16% | -0.07% | -0.05% | -0.11% | -0.05% | -0.15% | -0.18% |
The heat map shows percentage changes of major currencies against each other. The base currency is picked from the left column, while the quote currency is picked from the top row. For example, if you pick the Australian Dollar from the left column and move along the horizontal line to the US Dollar, the percentage change displayed in the box will represent AUD (base)/USD (quote).
Forex News
Keep up with the financial markets, know what's happening and what is affecting the markets with our latest market updates. Analyze market movers, trends and build your trading strategies accordingly.