USD/JPY Price Forecast: Rebounds from yearly lows, bulls' eye 150.00
- USD/JPY bounces off 148.85, approaching resistance at 150.73.
- Bullish harami pattern signals potential upside if momentum holds.
- Key resistance at 151.82 and 152.31; downside risk below 148.64.
The USD/JPY rebounds off yearly lows of 148.85 and climbs past the 149.50 mark late during the North American session on Monday, despite overall US Dollar weakness across the board. At the time of writing, the pair trades at 149.72, up 0.30%.
USD/JPY Price Forecast: Technical outlook
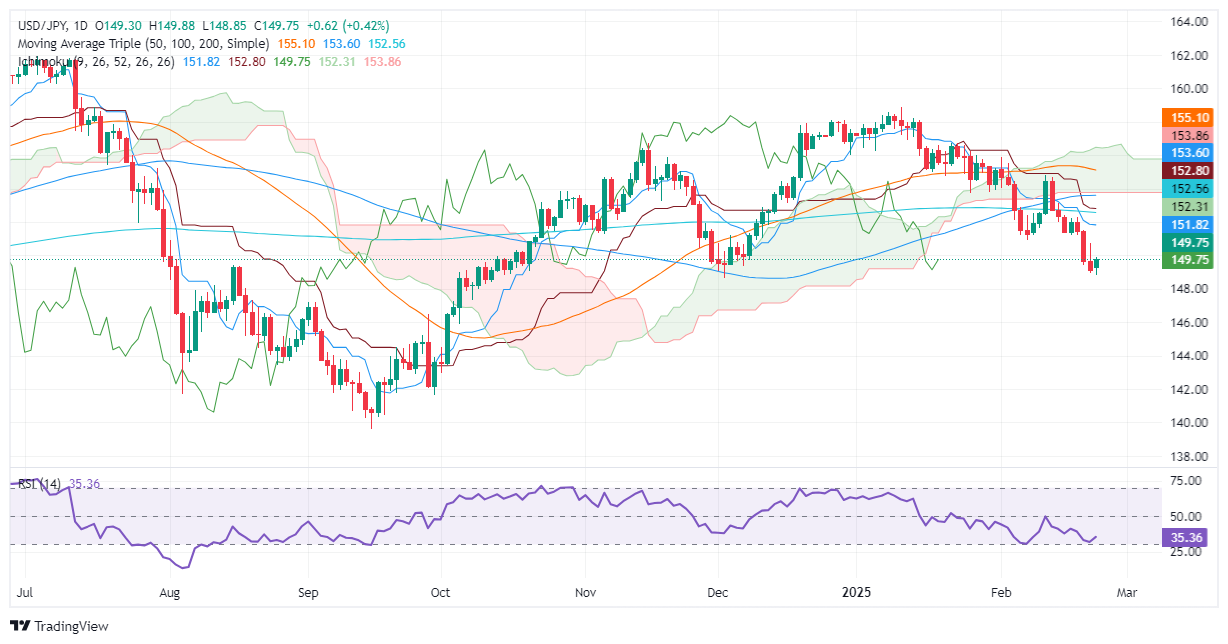
The daily chart depicts the pair as downward biased, with the USD/JPY exchange rate below the 200-day Simple Moving Average (SMA) of 152.57 and beneath the Ichimoku Cloud (Kumo).
Short-term, the USD/JPY could aim upward as it is forming the ‘bullish harami’ candle chart pattern. If it clears the February 21 peak of 150.73, the next resistance would be the Tenkan-sen at 151.82, followed by the Senkou Span A at 152.31. A breach of the latter will expose the 200-day SMA.
On the other hand, if USD/JPY surpassed the December 3 swing low of 148.64, the next support would be the September 27 swing high turned support at 146.49.
USD/JPY Price Chart – Daily
Japanese Yen PRICE Today
The table below shows the percentage change of Japanese Yen (JPY) against listed major currencies today. Japanese Yen was the strongest against the Swiss Franc.
| USD | EUR | GBP | JPY | CAD | AUD | NZD | CHF | |
|---|---|---|---|---|---|---|---|---|
| USD | -0.01% | -0.01% | 0.03% | -0.01% | -0.03% | 0.00% | 0.02% | |
| EUR | 0.00% | -0.01% | 0.05% | -0.01% | -0.02% | 0.00% | 0.03% | |
| GBP | 0.01% | 0.01% | 0.04% | 0.02% | -0.01% | 0.02% | 0.04% | |
| JPY | -0.03% | -0.05% | -0.04% | -0.03% | -0.04% | -0.01% | 0.00% | |
| CAD | 0.00% | 0.00% | -0.02% | 0.03% | -0.01% | 0.02% | 0.03% | |
| AUD | 0.03% | 0.02% | 0.00% | 0.04% | 0.00% | 0.03% | 0.05% | |
| NZD | -0.00% | -0.01% | -0.02% | 0.01% | -0.02% | -0.03% | 0.02% | |
| CHF | -0.02% | -0.03% | -0.04% | -0.00% | -0.03% | -0.05% | -0.02% |
The heat map shows percentage changes of major currencies against each other. The base currency is picked from the left column, while the quote currency is picked from the top row. For example, if you pick the Japanese Yen from the left column and move along the horizontal line to the US Dollar, the percentage change displayed in the box will represent JPY (base)/USD (quote).
Forex News
Keep up with the financial markets, know what's happening and what is affecting the markets with our latest market updates. Analyze market movers, trends and build your trading strategies accordingly.