
Japanese Yen strengthens further against USD; USD/JPY slides to mid-149.00s
- The Japanese Yen attracts some dip-buyers following an Asian session slide on Tuesday.
- Bets that the BoJ will hike interest rates further continue to act as a tailwind for the JPY.
- Retreating JGB yields might cap gains for the JPY and lend support to the USD/JPY pair.
The Japanese Yen (JPY) builds on steady intraday ascent against its American counterpart and drags the USD/JPY pair below mid-149.00s during the Asian session on Tuesday. Japan's Services Producer Price Index (PPI) released earlier this Tuesday underscores the view that rising wages are persuading firms to pass on higher labour costs through price hikes. This comes on top of Japan's strong consumer inflation figures and reaffirms bets that the Bank of Japan (BoJ) will hike interest rates further, which, in turn, continues to underpin the JPY.
Apart from this, a generally softer risk tone turns out to be another factor driving some haven flows toward the JPY, which, along with the emergence of fresh US Dollar (USD) selling, exerts pressure on the USD/JPY pair. Meanwhile, BoJ Governor Kazuo Ueda's remarks last week, saying that the central bank stands ready to increase government bond buying if long-term interest rates rise sharply, keep the Japanese government bond (JGB) yields depressed below a multi-year top. This might hold back the JPY bulls from placing aggressive bets
Japanese Yen bulls retain control as hawkish BoJ expectations offset retreating JGB yields
- Bank of Japan Governor Kazuo Ueda issued a mild warning last Friday and said that the central bank could increase bond buying if abnormal market moves trigger a sharp rise in yields.
- Ueda's remarks dragged the yield on the benchmark Japanese government bond away from its highest level since November 2009 and weighed on the Japanese Yen earlier this Tursday.
- Some market players, however, expect that the 10-year JGB could rise to 1.5% in the coming weeks, with growing acceptance that the BoJ will hike rates further amid broadening inflation in Japan.
- The bets were lifted by Japan's strong consumer inflation figures released last week and the Services Producer Price Index (PPI), which rose 3.1% YoY in January and signaled persistent cost pressures.
- The recent downbeat US economic data raised doubts about consumer health and the growth outlook amid worries that US President Donald Trump's tariff plans could undermine domestic demand.
- The S&P Global's flash US PMIs pointed to a weaker expansion in overall business activity and the University of Michigan's US Consumer Sentiment Index dropped to a 15-month low in February.
- Federal Reserve officials, however, remain wary of future rate cuts. In fact, Chicago Fed President Austan Goolsbee said that the central bank needs more clarity on Trump's policies before going back to cut rates.
- This assists the US Dollar in building on the previous day's bounce from its lowest level since December 10 and continues to push the USD/JPY pair higher for the second successive day on Tuesday.
- Traders now look to the US macro data – Conference Board's Consumer Confidence Index and Richmond Manufacturing Index. This, along with Fed speaks, might influence the USD.
- The focus, however, will remain glued to the release of the US Personal Consumption Expenditure (PCE) Price Index on Friday, which could provide cues about the Fed's rate-cut path.
USD/JPY could turn vulnerable on sustained break and acceptance below the 149.00 mark
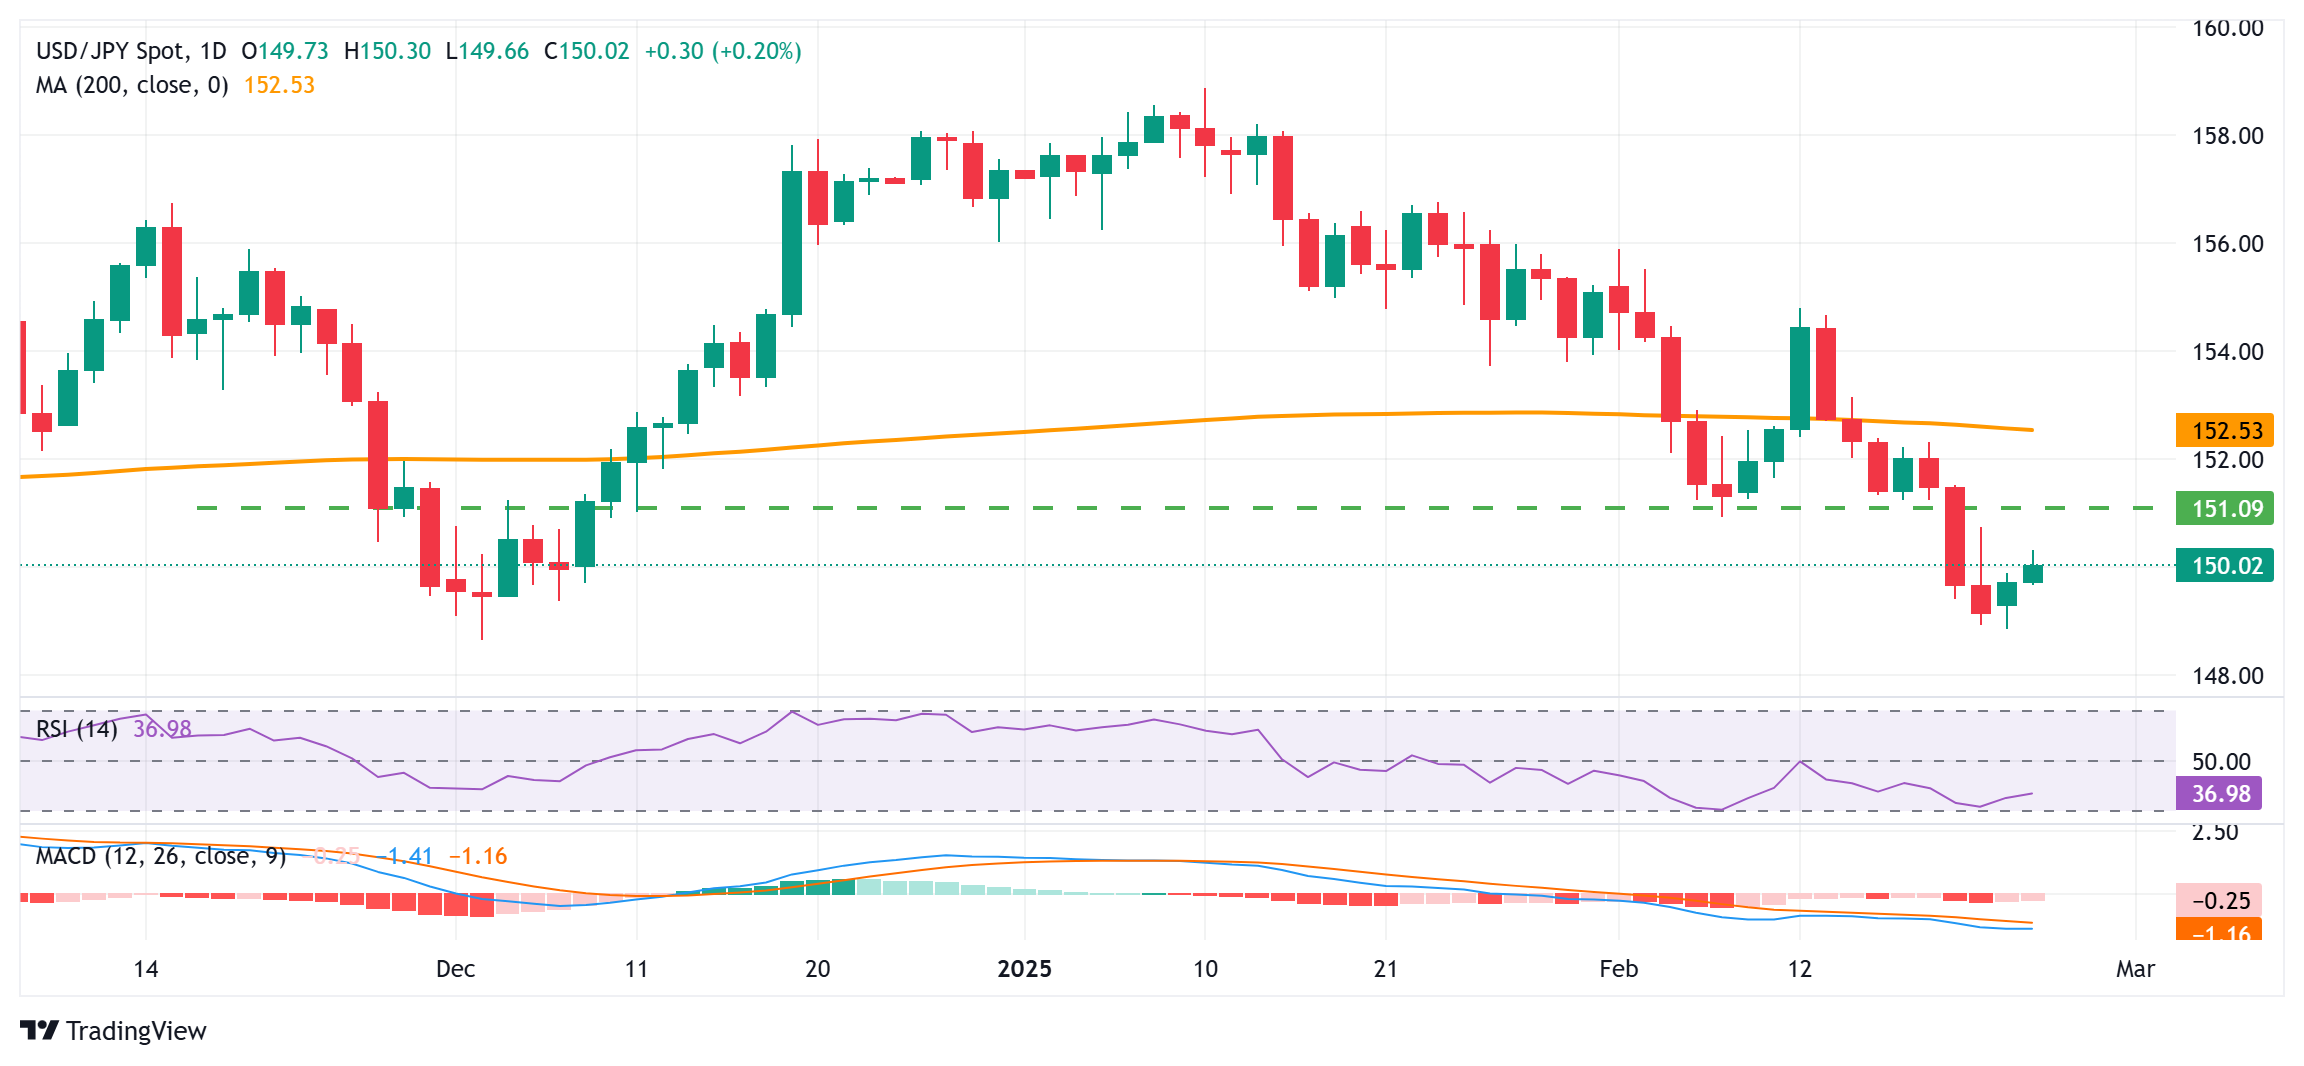
From a technical perspective, any subsequent move-up could attract fresh sellers and remain capped near the 150.90-151.00 horizontal support breakpoint. A sustained strength beyond, however, might trigger a short-covering rally and lift the USD/JPY pair towards the 151.40 intermediate hurdle en route to the 152.00 mark. The momentum could extend further, though it runs the risk of fizzling out rather quickly near the 152.65 area, representing the very important 200-day Simple Moving Average (SMA).
On the flip side, the 149.65-149.60 area, or the Asian session low now seems to protect the immediate downside ahead of the 149.30 region and the 149.00 round figure. Some follow-through selling below the 148.65 zone, or the lowest level since December 2024 touched on Monday, would be seen as a fresh trigger for bearish traders. Given that oscillators on the daily chart are holding deep in negative territory, the USD/JPY pair might then decline further towards the 148.00 mark en route to the 147.45 region before eventually dropping to the 147.00 round figure.
Japanese Yen PRICE This month
The table below shows the percentage change of Japanese Yen (JPY) against listed major currencies this month. Japanese Yen was the strongest against the US Dollar.
| USD | EUR | GBP | JPY | CAD | AUD | NZD | CHF | |
|---|---|---|---|---|---|---|---|---|
| USD | -0.65% | -1.60% | -3.01% | -1.63% | -2.15% | -1.71% | -1.36% | |
| EUR | 0.65% | -0.96% | -2.38% | -0.99% | -1.52% | -1.07% | -0.72% | |
| GBP | 1.60% | 0.96% | -1.46% | -0.03% | -0.57% | -0.11% | 0.25% | |
| JPY | 3.01% | 2.38% | 1.46% | 1.41% | 0.89% | 1.33% | 1.71% | |
| CAD | 1.63% | 0.99% | 0.03% | -1.41% | -0.53% | -0.08% | 0.28% | |
| AUD | 2.15% | 1.52% | 0.57% | -0.89% | 0.53% | 0.45% | 0.82% | |
| NZD | 1.71% | 1.07% | 0.11% | -1.33% | 0.08% | -0.45% | 0.37% | |
| CHF | 1.36% | 0.72% | -0.25% | -1.71% | -0.28% | -0.82% | -0.37% |
The heat map shows percentage changes of major currencies against each other. The base currency is picked from the left column, while the quote currency is picked from the top row. For example, if you pick the Japanese Yen from the left column and move along the horizontal line to the US Dollar, the percentage change displayed in the box will represent JPY (base)/USD (quote).
Forex News
Keep up with the financial markets, know what's happening and what is affecting the markets with our latest market updates. Analyze market movers, trends and build your trading strategies accordingly.