
GBP/USD Price Forecast: Holds gains above 1.2600 support near nine-day EMA
- The GBP/USD pair remains in an ascending channel pattern.
- The pair may face immediate resistance at the two-month high of 1.2690.
- The primary support appears at the nine-day EMA of 1.2597.
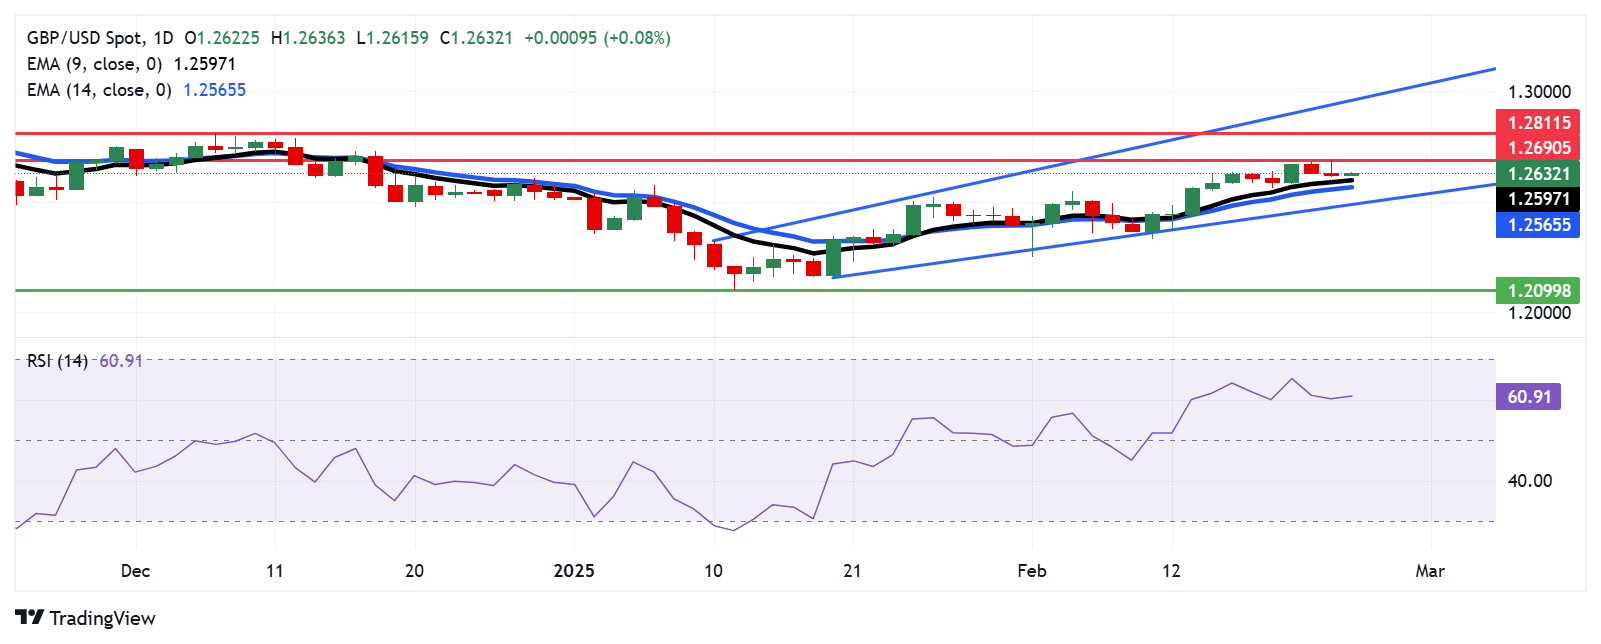
The GBP/USD pair gains ground after registering losses in the previous two successive sessions, trading around 1.2630 during the Asian session on Tuesday. However, technical analysis of the daily chart suggests a persistent bullish bias, with the pair continuing to move within an ascending channel pattern.
The 14-day Relative Strength Index (RSI) sits just above the 50 level, indicating increased bullish momentum. Moreover, the pair remains above the nine- and 14-day Exponential Moving Averages (EMAs), signaling strong short-term price dynamics and reinforcing the upward trend.
The GBP/USD pair may encounter immediate resistance at a two-month high of 1.2690, which was approached on February 24, followed by the three-month high at 1.2811, which was recorded on December 6. A break above the latter could reinforce the bullish bias and support the pair to test the upper boundary of the ascending channel at the 1.2960 level.
On the downside, the GBP/USD pair could find immediate support at the nine-day EMA of 1.2597, followed by the 14-day EMA at 1.2565 level. A break below these levels would weaken the short-term price momentum and lead the pair to approach the ascending channel’s lower boundary at the 1.2490 level.
GBP/USD: Daily Chart
British Pound PRICE Today
The table below shows the percentage change of British Pound (GBP) against listed major currencies today. British Pound was the strongest against the Japanese Yen.
| USD | EUR | GBP | JPY | CAD | AUD | NZD | CHF | |
|---|---|---|---|---|---|---|---|---|
| USD | -0.08% | -0.08% | 0.03% | -0.09% | -0.11% | -0.04% | -0.02% | |
| EUR | 0.08% | -0.00% | 0.11% | -0.02% | -0.04% | 0.03% | 0.06% | |
| GBP | 0.08% | 0.00% | 0.09% | -0.02% | -0.03% | 0.04% | 0.06% | |
| JPY | -0.03% | -0.11% | -0.09% | -0.12% | -0.13% | -0.08% | -0.05% | |
| CAD | 0.09% | 0.02% | 0.02% | 0.12% | -0.02% | 0.05% | 0.07% | |
| AUD | 0.11% | 0.04% | 0.03% | 0.13% | 0.02% | 0.07% | 0.09% | |
| NZD | 0.04% | -0.03% | -0.04% | 0.08% | -0.05% | -0.07% | 0.02% | |
| CHF | 0.02% | -0.06% | -0.06% | 0.05% | -0.07% | -0.09% | -0.02% |
The heat map shows percentage changes of major currencies against each other. The base currency is picked from the left column, while the quote currency is picked from the top row. For example, if you pick the British Pound from the left column and move along the horizontal line to the US Dollar, the percentage change displayed in the box will represent GBP (base)/USD (quote).
Forex News
Keep up with the financial markets, know what's happening and what is affecting the markets with our latest market updates. Analyze market movers, trends and build your trading strategies accordingly.