Silver Price Forecast: XAG/USD trades with positive bias below mid-$32.00s
- Silver attracts some buyers on Tuesday and snaps a two-day losing streak.
- Mixed technical indicators on the daily chart warrant some caution for bulls.
- Corrective slides could be seen as a buying opportunity and remain limited.
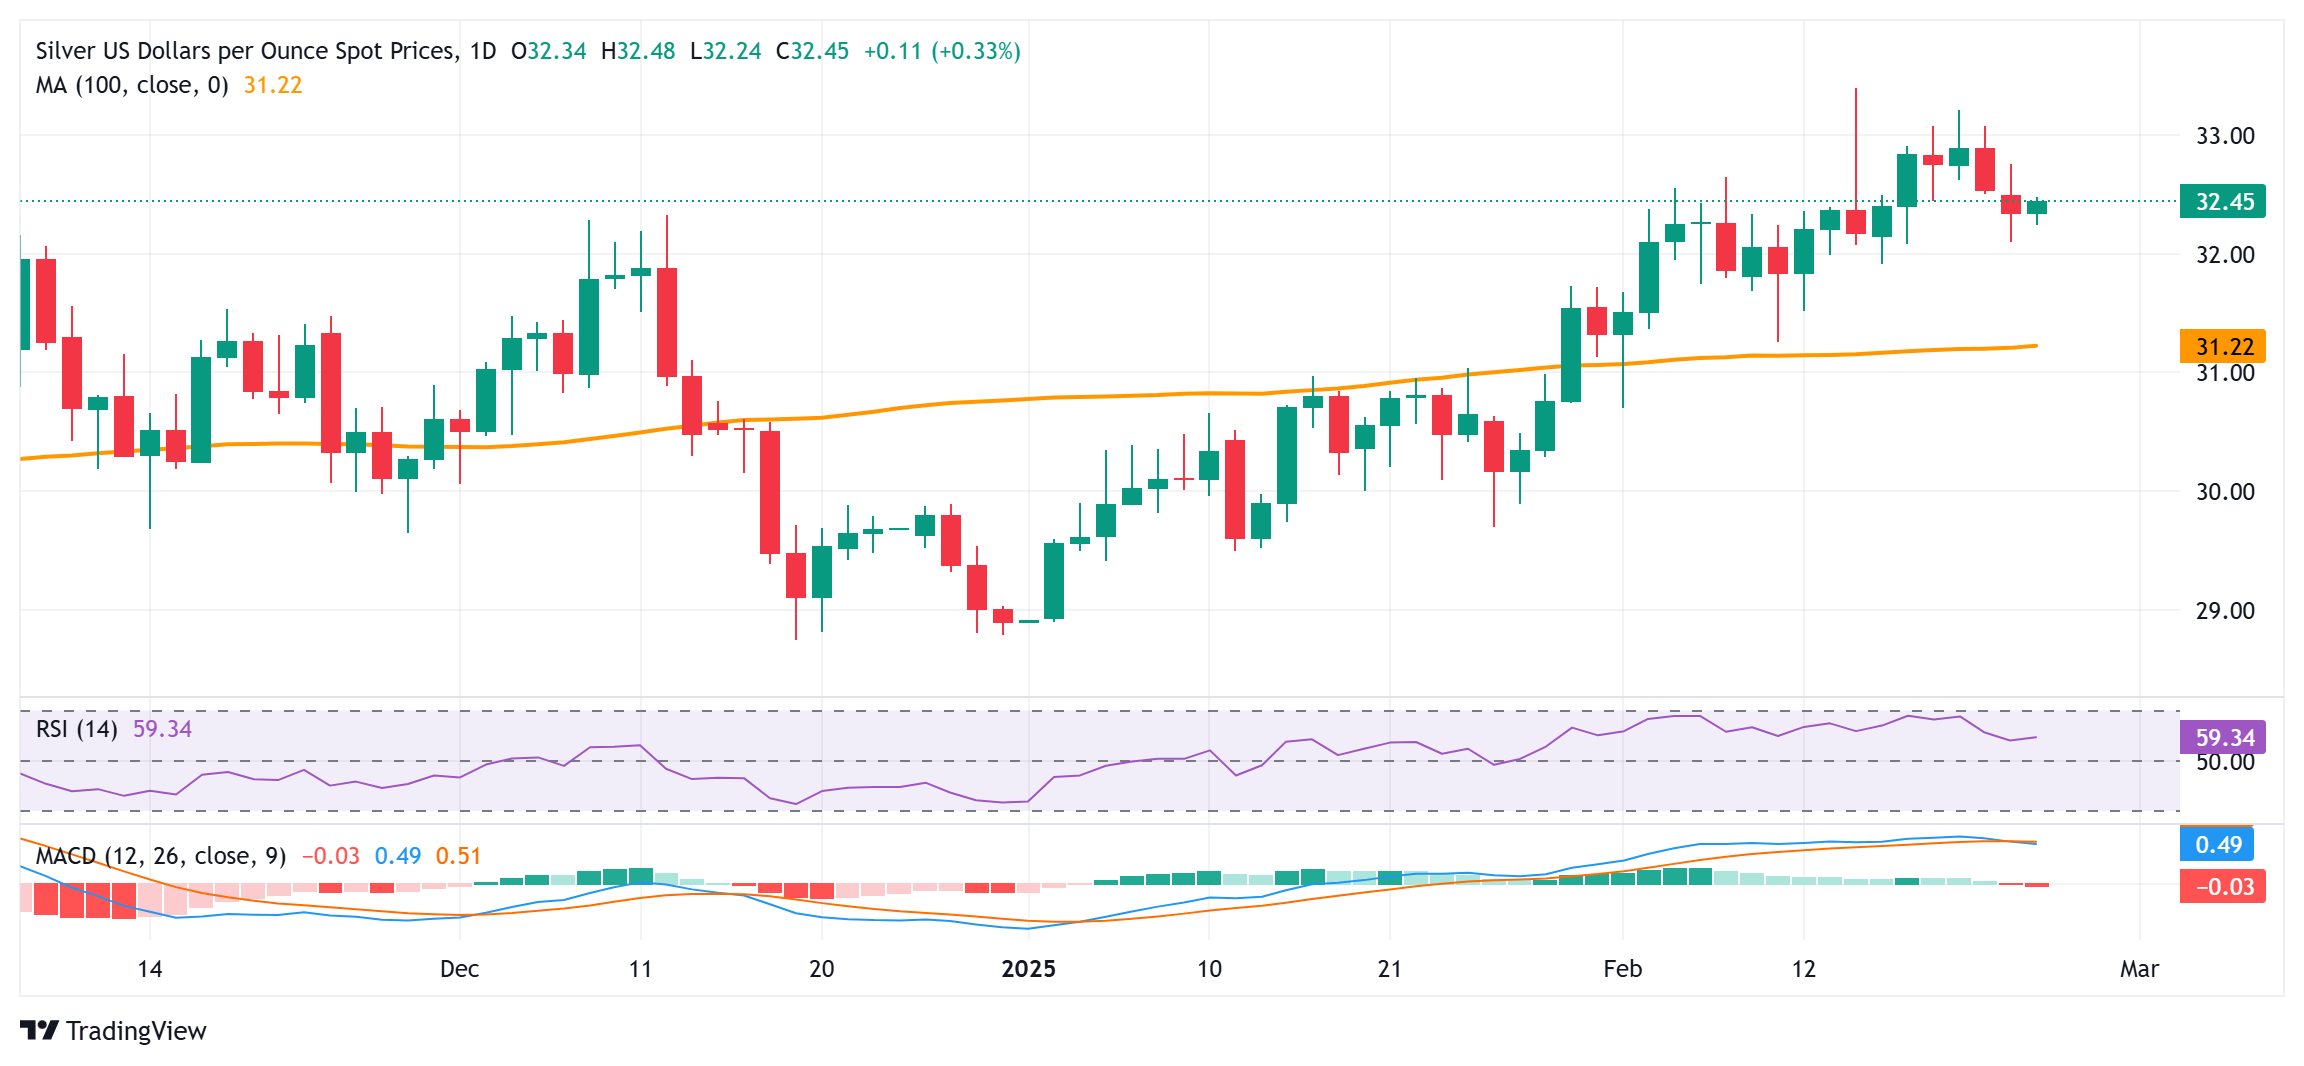
Silver (XAG/USD) builds on the previous day's modest bounce from the vicinity of the $32.00 mark, or a nearly one-week low, and gains some positive traction during the Asian session on Tuesday. The white metal, for now, seems to have snapped a two-day losing streak and currently trades just below mid-$32.00s, up 0.25% for the day.
From a technical perspective, the recent repeated failures to find acceptance above the $33.00 mark and the subsequent pullback warrant caution for bullish traders amid mixed oscillators on the daily chart. Hence, it will be prudent to wait for sustained strength and acceptance above the said handle before positioning for an extension of a well-established uptrend from sub-$29.00 levels, or the year-to-date low touched in January.
The XAG/USD might then aim to surpass the monthly swing high, around the $33.40 area touched on February 14, and climb further towards reclaiming the $34.00 mark. The momentum could extend further towards the $34.45 intermediate hurdle en route to the $35.00 neighborhood, or the multi-year peak touched in October.
On the flip side, the $32.10-$32.00 area now seems to have emerged as an immediate strong support ahead of the $31.75 region. Any further slide could be seen as a buying opportunity and help limit the downside for the XAG/USD near the $31.25 zone. The latter coincides with the 100-day Simple Moving Average (SMA) and should act as a key pivotal point. Hence, a convincing break below might shift the bias in favor of bearish traders.
The subsequent decline has the potential to drag the XAG/USD below the $31.00 round-figure mark, towards testing the the next relevant support near the $30.25 region, the $30.00 psychological mark, and the $29.55-$29.50 horizontal zone.
Silver daily chart
Silver FAQs
Silver is a precious metal highly traded among investors. It has been historically used as a store of value and a medium of exchange. Although less popular than Gold, traders may turn to Silver to diversify their investment portfolio, for its intrinsic value or as a potential hedge during high-inflation periods. Investors can buy physical Silver, in coins or in bars, or trade it through vehicles such as Exchange Traded Funds, which track its price on international markets.
Silver prices can move due to a wide range of factors. Geopolitical instability or fears of a deep recession can make Silver price escalate due to its safe-haven status, although to a lesser extent than Gold's. As a yieldless asset, Silver tends to rise with lower interest rates. Its moves also depend on how the US Dollar (USD) behaves as the asset is priced in dollars (XAG/USD). A strong Dollar tends to keep the price of Silver at bay, whereas a weaker Dollar is likely to propel prices up. Other factors such as investment demand, mining supply – Silver is much more abundant than Gold – and recycling rates can also affect prices.
Silver is widely used in industry, particularly in sectors such as electronics or solar energy, as it has one of the highest electric conductivity of all metals – more than Copper and Gold. A surge in demand can increase prices, while a decline tends to lower them. Dynamics in the US, Chinese and Indian economies can also contribute to price swings: for the US and particularly China, their big industrial sectors use Silver in various processes; in India, consumers’ demand for the precious metal for jewellery also plays a key role in setting prices.
Silver prices tend to follow Gold's moves. When Gold prices rise, Silver typically follows suit, as their status as safe-haven assets is similar. The Gold/Silver ratio, which shows the number of ounces of Silver needed to equal the value of one ounce of Gold, may help to determine the relative valuation between both metals. Some investors may consider a high ratio as an indicator that Silver is undervalued, or Gold is overvalued. On the contrary, a low ratio might suggest that Gold is undervalued relative to Silver.
Forex News
Keep up with the financial markets, know what's happening and what is affecting the markets with our latest market updates. Analyze market movers, trends and build your trading strategies accordingly.