Australian Dollar declines as US Dollar holds gains ahead of Initial Jobless Claims
- The Australian Dollar depreciates after the release of lower-than-expected Trade Balance data.
- Australia's trade surplus fell to 5,085M in December, the smallest balance since last September.
- The US Dollar faced challenges as the ISM Services PMI eased in January.
The Australian Dollar (AUD) edges lower against the US Dollar (USD) following lower-than-expected Trade Balance data released on Thursday. Additionally, the AUD/USD pair receives downward pressure from risk-off sentiment amid rising fears over US-China trade tensions.
Australia's trade surplus fell to 5,085M in December, missing the expected 7,000M and down from the previous surplus of 6,792M. Exports increased by 1.1% MoM, slowing from November's 4.2% rise, while imports surged 5.9% MoM, up from 1.4% in the prior month.
Traders closely watch the ongoing trade war between the United States (US) and China, Australia’s key trading partner. China retaliated against the new 10% US tariff that took effect on Tuesday. However, Trump stated on Monday afternoon that he would likely speak with China within the next 24 hours. He also warned, "If we can't reach a deal with China, the tariffs will be very, very substantial."
Australian Dollar receives downward pressure from rising US-China trade tensions
- The US Dollar Index (DXY), which measures the US Dollar’s value against six major currencies, remains subdued near 107.50 at the time of writing. The weaker US Services Purchasing Manager Index (PMI) could have weighed on the Greenback.
- The US ISM Services PMI eased to 52.8 in January from 54.0 (revised from 54.1) in December. This reading came in below the market consensus of 54.3.
- Traders brace for Friday’s US Nonfarm Payrolls (NFP) data, which is expected to shape the Federal Reserve’s (Fed) monetary policy direction.
- On Thursday, Federal Reserve Vice Chair Philip Jefferson expressed his satisfaction with keeping the Fed Funds rate at its current level, stating that he will assess the overall impact of Trump's policies before making further decisions. He also emphasized that the Fed's rate remains restrictive for the economy, even with a 100-basis-point decline.
- President Trump has agreed to a 30-day suspension of the proposed 25% tariffs on Canadian and Mexican imports. This decision comes after Canadian Prime Minister Justin Trudeau and Mexican President Claudia Sheinbaum committed to enhancing border security measures to address concerns over illegal immigration and drug trafficking.
- China’s Commerce Ministry announced that it will impose a 15% tariff on US coal and liquefied natural gas (LNG) imports, along with an additional 10% tariff on crude Oil, farm equipment, and certain automobiles. Additionally, to "safeguard national security interests," China is implementing export controls on tungsten, tellurium, ruthenium, molybdenum, and related products.
- According to the Financial Times, Chinese exporters are intensifying their efforts to offshore production in response to Trump’s tariffs. Manufacturers in China are accelerating plans to relocate production to other countries, including the Middle East, to avoid US tariffs. Other tactics being considered include passing the increased costs onto US consumers and exploring alternative markets.
- JOLTS Job Openings fell to 7.6 million in December, missing the 8 million consensus estimate. The US labor market remains stable with total separations remaining little changed at 5.3 million in December.
- San Francisco Fed Bank President Mary Daly stated on Tuesday that the central bank remains in a wait-and-see stance, emphasizing the impact of economic uncertainty on policymaking. While the economy is performing well and maintaining momentum, uncertainty persists. As a result, the Fed has the flexibility to carefully assess data before making policy adjustments.
- Australia’s Judo Bank Composite PMI climbed to 51.1 in January from 50.2 in December, reflecting modest growth in private sector activity. Meanwhile, the Judo Bank Services PMI rose to 51.2 from 50.8, marking the twelfth consecutive month of expansion in the services sector. Although growth was moderate, it was the strongest since August.
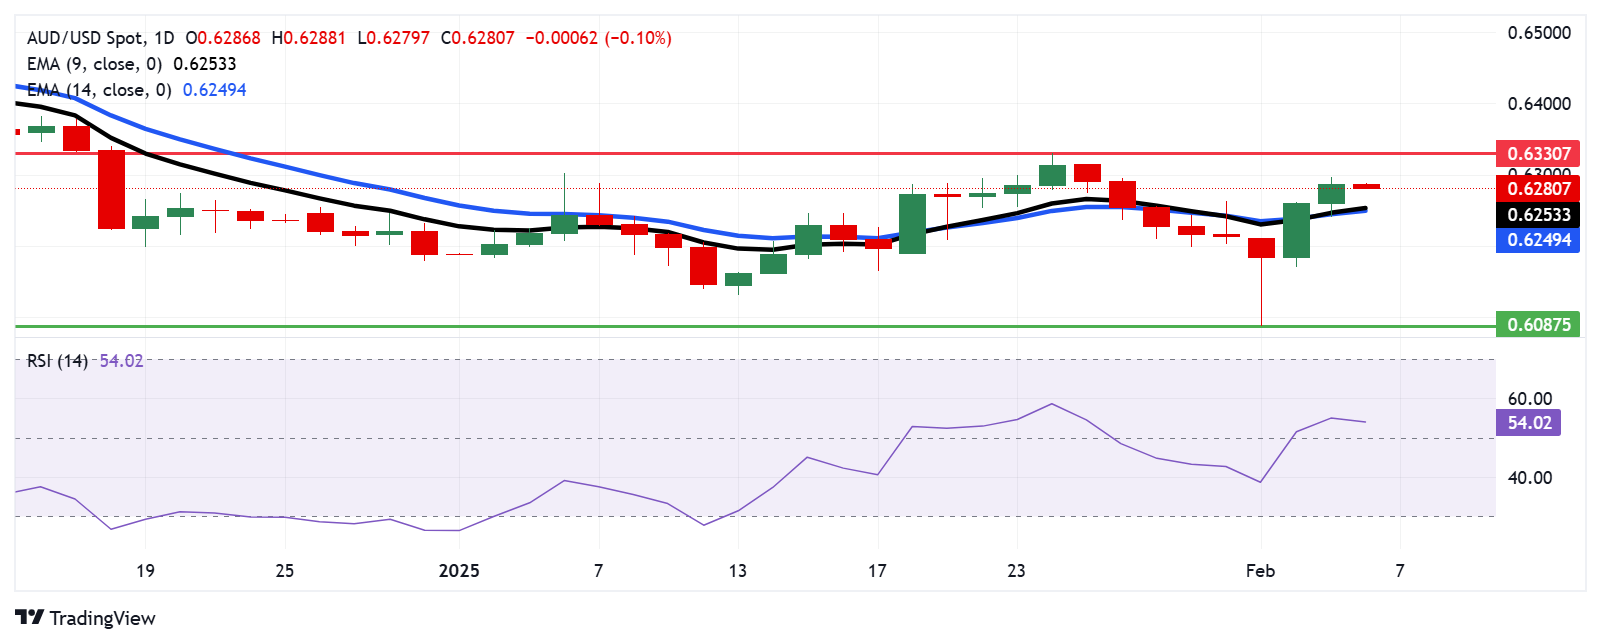
Australian Dollar pulls back from 0.6300, support appears at nine-day EMA
The AUD/USD pair trades near 0.6280 on Thursday. Sustained price action above the nine- and 14-day Exponential Moving Averages (EMAs) on the daily chart indicates a stronger short-term bullish momentum. Additionally, the 14-day Relative Strength Index (RSI) is positioned above the 50 level, confirming a stronger bullish trend.
On the upside, the AUD/USD pair could explore the area around its seven-week high at 0.6330 level, which was recorded on January 24.
The AUD/USD pair may find immediate support at the nine-day EMA near 0.6254, followed by the 14-day EMA at 0.6249 level. A break below these EMAs could weaken the bullish bias, potentially driving the pair toward 0.6087, the lowest level since April 2020, which was recorded on February 3.
AUD/USD: Daily Chart
Australian Dollar PRICE Today
The table below shows the percentage change of Australian Dollar (AUD) against listed major currencies today. Australian Dollar was the weakest against the Japanese Yen.
| USD | EUR | GBP | JPY | CAD | AUD | NZD | CHF | |
|---|---|---|---|---|---|---|---|---|
| USD | 0.16% | 0.10% | -0.20% | 0.19% | 0.31% | 0.35% | 0.15% | |
| EUR | -0.16% | -0.06% | -0.35% | 0.03% | 0.15% | 0.20% | -0.03% | |
| GBP | -0.10% | 0.06% | -0.34% | 0.09% | 0.21% | 0.26% | 0.06% | |
| JPY | 0.20% | 0.35% | 0.34% | 0.41% | 0.54% | 0.54% | 0.38% | |
| CAD | -0.19% | -0.03% | -0.09% | -0.41% | 0.13% | 0.17% | -0.02% | |
| AUD | -0.31% | -0.15% | -0.21% | -0.54% | -0.13% | 0.04% | -0.18% | |
| NZD | -0.35% | -0.20% | -0.26% | -0.54% | -0.17% | -0.04% | -0.19% | |
| CHF | -0.15% | 0.03% | -0.06% | -0.38% | 0.02% | 0.18% | 0.19% |
The heat map shows percentage changes of major currencies against each other. The base currency is picked from the left column, while the quote currency is picked from the top row. For example, if you pick the Australian Dollar from the left column and move along the horizontal line to the US Dollar, the percentage change displayed in the box will represent AUD (base)/USD (quote).
Economic Indicator
Initial Jobless Claims
The Initial Jobless Claims released by the US Department of Labor is a measure of the number of people filing first-time claims for state unemployment insurance. A larger-than-expected number indicates weakness in the US labor market, reflects negatively on the US economy, and is negative for the US Dollar (USD). On the other hand, a decreasing number should be taken as bullish for the USD.
Read more.Next release: Thu Feb 06, 2025 13:30
Frequency: Weekly
Consensus: 213K
Previous: 207K
Source: US Department of Labor
Every Thursday, the US Department of Labor publishes the number of previous week’s initial claims for unemployment benefits in the US. Since this reading could be highly volatile, investors may pay closer attention to the four-week average. A downtrend is seen as a sign of an improving labour market and could have a positive impact on the USD’s performance against its rivals and vice versa.
Forex News
Keep up with the financial markets, know what's happening and what is affecting the markets with our latest market updates. Analyze market movers, trends and build your trading strategies accordingly.