Silver Price Forecast: XAG/USD maintains position around $32.50, three-month highs
- Silver price holds ground near its three-month high of $32.56, recorded on February 5.
- A break above the 70 RSI level could indicate overbought conditions, potentially triggering a downward correction.
- The critical support zone appears at a nine-day EMA at $31.58, followed by the ascending channel’s lower boundary at $31.00.
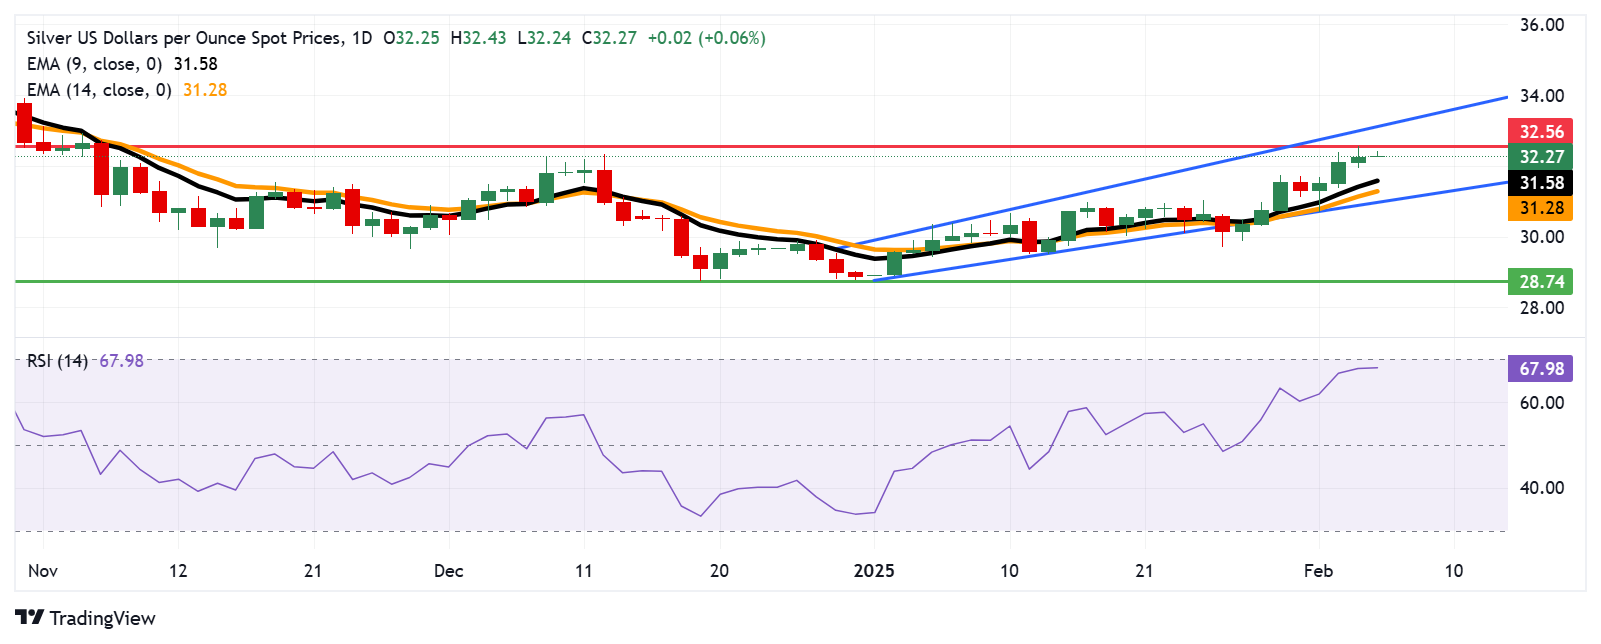
Silver price (XAG/USD) extends its winning streak for the fourth consecutive session, trading near $32.30 per troy ounce during Asian hours on Thursday. Technical analysis on the daily chart highlights a strong bullish bias, with the price maintaining an upward trajectory within an ascending channel.
The XAG/USD pair remains above both the nine-day and 14-day Exponential Moving Averages (EMAs), indicating solid short-term momentum. Additionally, the 14-day Relative Strength Index (RSI) is approaching the 70 level, reinforcing bullish sentiment. A break above the 70 mark could signal overbought conditions, potentially leading to a downward correction.
On the upside, Silver price faces immediate resistance at its three-month high of $32.56, last reached on February 5. A decisive breakout above this level could pave the way for a test of the ascending channel’s upper boundary at $33.10.
Support levels include the nine-day EMA at $31.58, followed by the 14-day EMA at $31.28, and the lower boundary of the ascending channel at $31.00. A drop below this critical support zone could weaken the bullish outlook, exposing the XAG/USD pair to further downside toward its five-month low of $28.74, recorded on December 19.
XAG/USD: Daily Chart
Silver FAQs
Silver is a precious metal highly traded among investors. It has been historically used as a store of value and a medium of exchange. Although less popular than Gold, traders may turn to Silver to diversify their investment portfolio, for its intrinsic value or as a potential hedge during high-inflation periods. Investors can buy physical Silver, in coins or in bars, or trade it through vehicles such as Exchange Traded Funds, which track its price on international markets.
Silver prices can move due to a wide range of factors. Geopolitical instability or fears of a deep recession can make Silver price escalate due to its safe-haven status, although to a lesser extent than Gold's. As a yieldless asset, Silver tends to rise with lower interest rates. Its moves also depend on how the US Dollar (USD) behaves as the asset is priced in dollars (XAG/USD). A strong Dollar tends to keep the price of Silver at bay, whereas a weaker Dollar is likely to propel prices up. Other factors such as investment demand, mining supply – Silver is much more abundant than Gold – and recycling rates can also affect prices.
Silver is widely used in industry, particularly in sectors such as electronics or solar energy, as it has one of the highest electric conductivity of all metals – more than Copper and Gold. A surge in demand can increase prices, while a decline tends to lower them. Dynamics in the US, Chinese and Indian economies can also contribute to price swings: for the US and particularly China, their big industrial sectors use Silver in various processes; in India, consumers’ demand for the precious metal for jewellery also plays a key role in setting prices.
Silver prices tend to follow Gold's moves. When Gold prices rise, Silver typically follows suit, as their status as safe-haven assets is similar. The Gold/Silver ratio, which shows the number of ounces of Silver needed to equal the value of one ounce of Gold, may help to determine the relative valuation between both metals. Some investors may consider a high ratio as an indicator that Silver is undervalued, or Gold is overvalued. On the contrary, a low ratio might suggest that Gold is undervalued relative to Silver.
Forex News
Keep up with the financial markets, know what's happening and what is affecting the markets with our latest market updates. Analyze market movers, trends and build your trading strategies accordingly.