Japanese Yen trims part of strong intraday gains; USD/JPY rebounds to 153.25-153.30 area
- The Japanese Yen strengthens against the USD for the third straight day on Thursday.
- The divergent BoJ-Fed policy expectations continue to underpin the lower-yielding JPY.
- A positive risk tone caps the safe-haven JPY and offers support to the USD/JPY pair.
The Japanese Yen (JPY) trims a part of strong intraday gains against its American counterpart and assists the USD/JPY pair to rebound over 50 pips from the lowest level since December 12 touched during the Asian session on Thursday. Any meaningful JPY depreciation, however, seems elusive in the wake of the growing acceptance that the Bank of Japan (BoJ) would keep raising interest rates. This marks a big divergence in comparison to expectations that the Federal Reserve (Fed) will lower borrowing costs further by the end of this year. The resultant narrowing of the rate differential between Japan and the US turns out to be another factor driving flows toward the lower-yielding JPY.
That said, worries that Japan would also be an eventual target for US President Donald Trump's trade tariffs and the risk-on mood cap gains for the safe-haven JPY. Apart from this, a modest US Dollar (USD) rebound from over a one-week low touched on Wednesday offers some support to the USD/JPY pair. Meanwhile, the prospects for further policy easing by the Fed, along with the recent decline in the US Treasury bond yields, could act as a headwind for the USD. This, in turn, warrants some caution before confirming that the currency pair has bottomed out in the near term. Traders now look forward to the release of the US Weekly Initial Jobless Claims data for short-term impetus.
Japanese Yen bulls turn cautious amid positive risk tone, modest USD rebound
- Data released on Wednesday showed a rise in Japan's real wages, which reaffirms bets that the Bank of Japan will raise interest rates again and continues to underpin the Japanese Yen.
- Japan's Finance Minister, Katsunobu Kato, said on Thursday that he sees inflationary conditions as prices continue to rise further, though the end of deflation has not yet been achieved.
- Separately, BoJ Board Member, Tamura Naoki, backed faster interest rate hikes and said that the central bank must raise rates at least to around 1% in the latter half of fiscal 2025.
- According to LSEG, market participants are currently pricing around a 94.8% chance for a quarter-point hike by the BoJ at its September monetary policy meeting.
- In contrast, the markets are pricing in the possibility that the Federal Reserve will cut interest rates twice by the end of this year amid signs of a slowdown in the US job market.
- The Job Openings and Labor Turnover Survey (JOLTS) showed on Tuesday that the number of job openings fell from 8.09 million in the previous month to 7.6 million in December.
- Moreover, the Institute of Supply Management (ISM) reported that the economic activity in the US service sector continued to expand in January, albeit at a softer pace than in December.
- The US ISM Services PMI declined from 54.0 to 52.8 in January and the Prices Paid Index dropped to 60.4 from 64.4, while the Employment Index edged higher to 52.3 from 51.3.
- The softer services activity data dragged the US Treasury bond yields lower, which undermined the US Dollar and exerted heavy downward pressure on the USD/JPY pair.
- The USD failed to gain respite from the Automatic Data Processing (ADP) report, which showed that the private sector added 183K in January compared to 176K in the previous month.
- Fed Vice Chair Philip Jefferson said on Thursday that he is happy to keep the Fed Funds on hold at the current level and that he will wait to see the net effect of Trump's policies.
- Thursday's US economic docket features the release of Challenger Job Cuts and the usual Weekly Initial Jobless Claims data, which might provide some impetus to the Greenback.
- The market focus, however, will remain glued to the closely-watched US monthly employment details – popularly known as Nonfarm Payrolls (NFP) report due on Friday.
USD/JPY could attract fresh sellers near 152.50 confluence support breakpoint
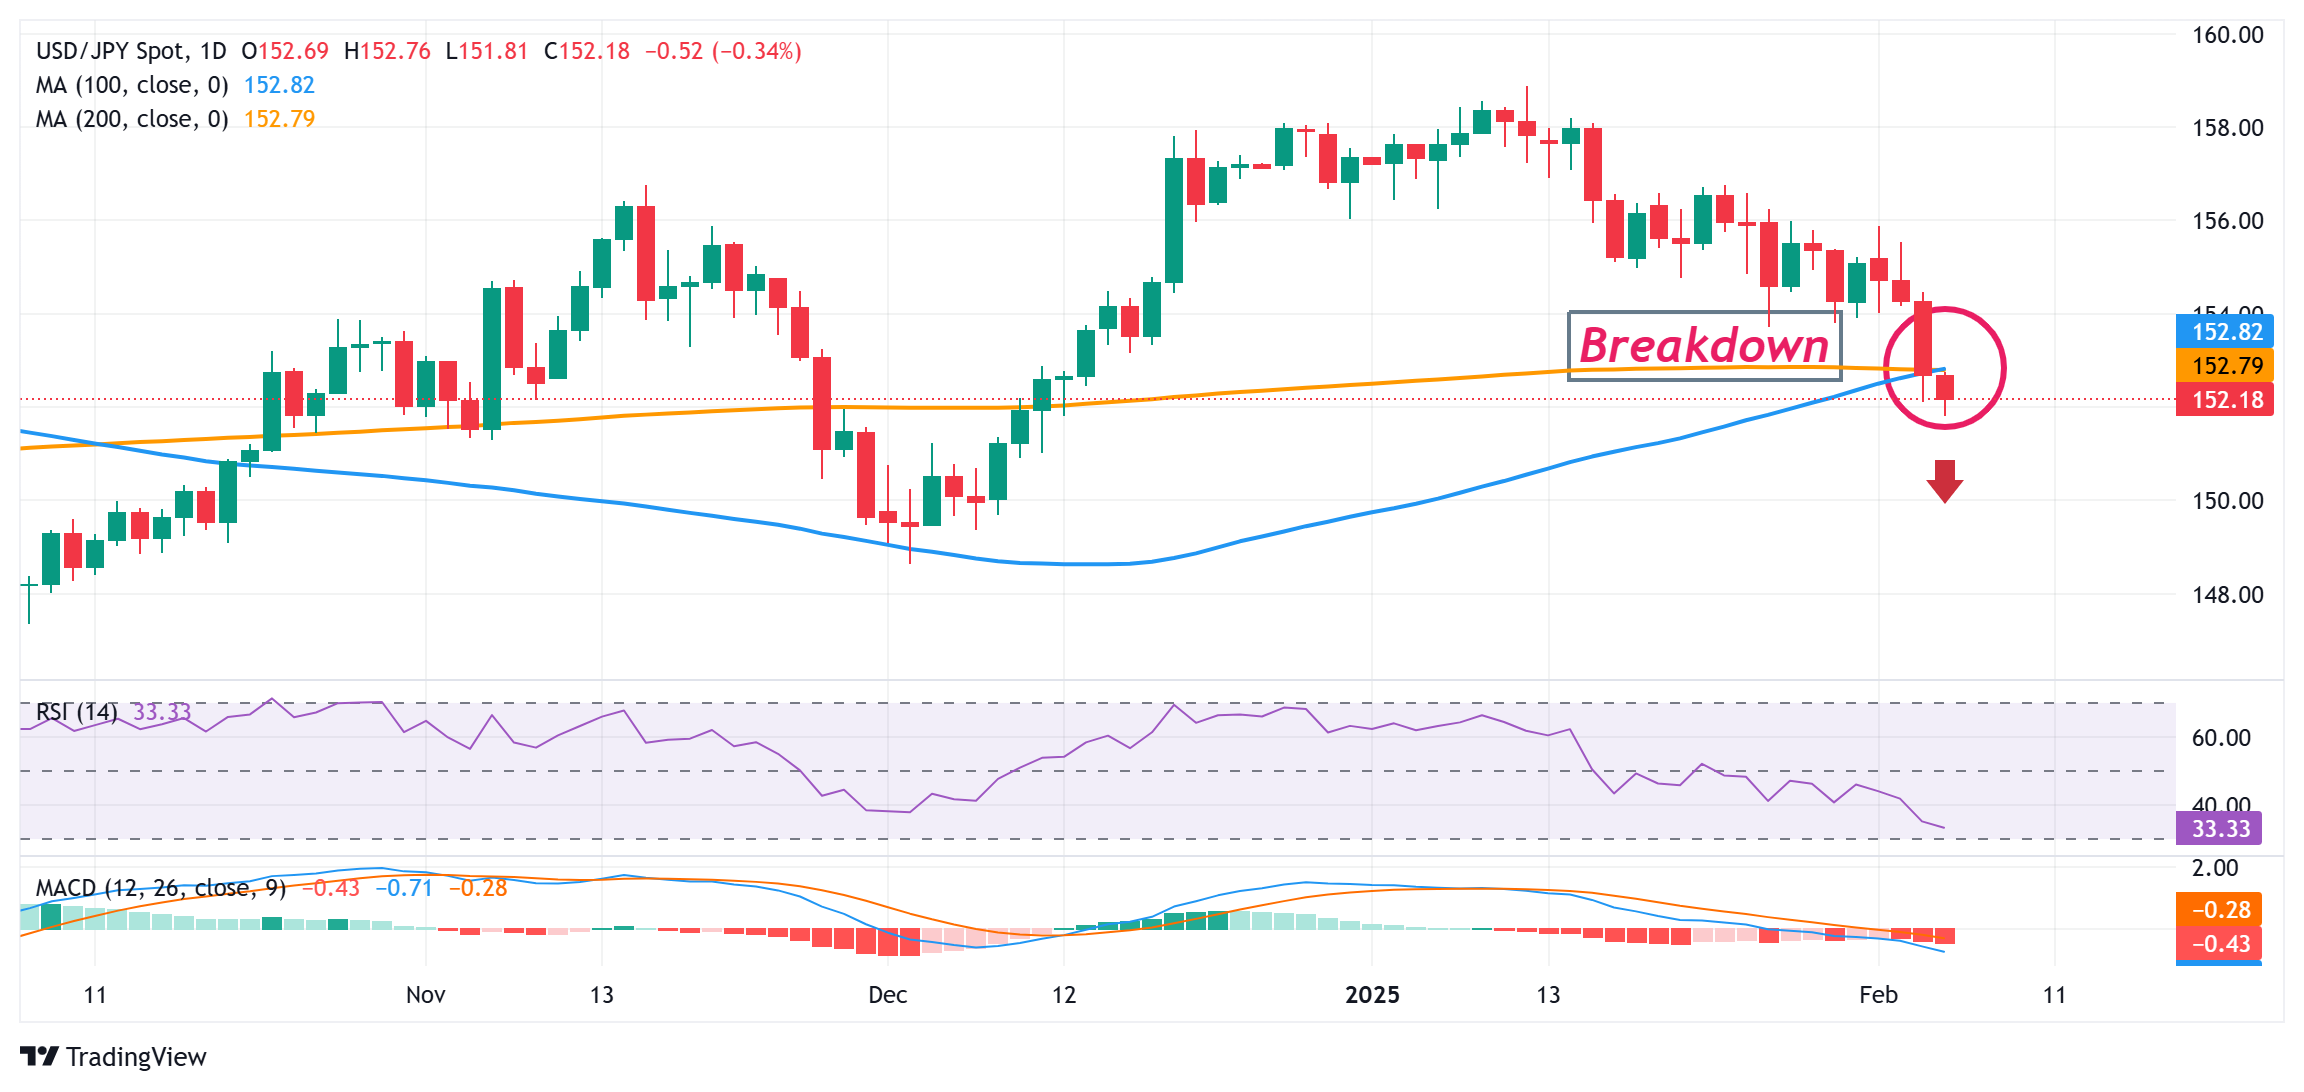
From a technical perspective, the overnight breakdown and close below the 152.50-152.45 confluence – comprising the 100- and the 200-day Simple Moving Averages (SMAs) was seen as a fresh trigger for bearish traders. A subsequent fall below the 152.00 mark validates the negative outlook and suggests that the path of least resistance for the USD/JPY pair remains to the downside. Given that oscillators on the daily chart are still away from being in the oversold zone, spot prices could slide further toward the 151.50 intermediate support en route to the 151.00 mark and the 150.60 horizontal support.
On the flip side, an attempted recovery might now confront stiff resistance and remain capped near the 152.50 confluence support breakpoint. A sustained strength beyond, however, might trigger a short-covering rally and lift the USD/JPY pair beyond the 153.00 mark, toward testing the next relevant hurdle near the 153.70-153.80 region. This is closely followed by the 154.00 round figure, which if cleared might negate the negative outlook and shift the near-term bias in favor of bullish traders.
US Dollar PRICE Today
The table below shows the percentage change of US Dollar (USD) against listed major currencies today. US Dollar was the strongest against the New Zealand Dollar.
| USD | EUR | GBP | JPY | CAD | AUD | NZD | CHF | |
|---|---|---|---|---|---|---|---|---|
| USD | 0.16% | 0.10% | -0.27% | 0.22% | 0.35% | 0.37% | 0.16% | |
| EUR | -0.16% | -0.06% | -0.43% | 0.06% | 0.20% | 0.22% | -0.02% | |
| GBP | -0.10% | 0.06% | -0.42% | 0.12% | 0.25% | 0.28% | 0.06% | |
| JPY | 0.27% | 0.43% | 0.42% | 0.50% | 0.63% | 0.62% | 0.44% | |
| CAD | -0.22% | -0.06% | -0.12% | -0.50% | 0.14% | 0.15% | -0.06% | |
| AUD | -0.35% | -0.20% | -0.25% | -0.63% | -0.14% | 0.02% | -0.21% | |
| NZD | -0.37% | -0.22% | -0.28% | -0.62% | -0.15% | -0.02% | -0.21% | |
| CHF | -0.16% | 0.02% | -0.06% | -0.44% | 0.06% | 0.21% | 0.21% |
The heat map shows percentage changes of major currencies against each other. The base currency is picked from the left column, while the quote currency is picked from the top row. For example, if you pick the US Dollar from the left column and move along the horizontal line to the Japanese Yen, the percentage change displayed in the box will represent USD (base)/JPY (quote).
Forex News
Keep up with the financial markets, know what's happening and what is affecting the markets with our latest market updates. Analyze market movers, trends and build your trading strategies accordingly.