US Dollar sees markets ignore geopolitical phone calls and focusses on Fed decision
- The US Dollar trades stronger, with a big surge against the Turkish Lira.
- Traders try to determine the impact of the upcoming Federal Reserve rate decision this Wednesday.
- The US Dollar Index is still stuck between 103.00 and 104.00 for now.
The US Dollar Index (DXY), which tracks the performance of the US Dollar (USD) against six major currencies, ticks up to 103.67 at the time of writing on Wednesday. The surge in the Greenback came on the back of a steep pop of over 5% in the USD against the Turkish Lira (TRY) after headlines emerged that authorities detained Istanbul mayor Ekrem Imamoglu, President Tayyip Erdogan's main political rival, on charges including corruption and aiding a terrorist group.
On the economic data front, it is a very calm day in the runup towards the Federal Reserve (Fed) decision on interest rates later in the day. The Federal Open Market Committee (FOMC) is set to announce its policy rate decision and publish the Summary of Economic Projections (SEP) update. After the meeting, Fed Chairman Jerome Powell will comment in a press conference. With the Trump policy in the backdrop, markets will want to know how many, if any, rate cuts the Fed members have penciled in for 2025 and beyond.
Daily digest market movers: Phone calls lead to nothing
- This Wednesday US President Donald Trump had a phone call with Ukraine president Volodymyr Zelenskyy. The phone call comes just a day after US President Donald Trump held a phone call with Russian President Vladimir Putin. Although markets are hoping for a ceasefire truce or even a peace deal, the outcome of this initial phone call was very bleak with Russia having an extensive list of demands.
- At 18:00 GMT, the Fed will release its Interest Rate Decision and Monetary Policy Statement, along with the Summary of Economic Projections.
- The policy rate is expected to remain unchanged in the 4.25%-4.50% range.
- Besides that, the Interest Rate Projections in the SEP update might suggest how many rate cuts the Fed expects for 2025 and 2026.
- At 18:30 GMT, Fed Chairman Jerome Powell will deliver a statement and take questions in a press conference.
- Equities are splitting up in the US trading session, with US equities advancing while European equities dip.
- According to the CME Fedwatch Tool, the probability of interest rates being lower than current levels in May currently stands at 16.8%, compared to 21.5% on Tuesday. For June, the odds for borrowing costs being lower stand at 62.6%.
- The US 10-year yield trades around 4.31% and is very stable on the day, off its near five-month low of 4.10% printed on March 4.
US Dollar Index Technical Analysis: Fed's Powell holds the key
The US Dollar Index (DXY) withstood another firm pressure on its downside support level near 103.18 on Tuesday. The fact that the support can refrain the DXY from hitting a new six-month low suggests that markets are awaiting more clarity on tariffs, the US economy, inflation and geopolitics. The DXY is at a crossroads where, once the 103.18 level gets broken, might not come back for a long time now that several banks are starting to call for more US Dollar devaluation in the coming years, according to Bloomberg.
A return to 104.00 would mean the DXY simply stays loyal to its range for March. If bulls can avoid a technical rejection there, look for a large sprint higher towards the 105.00 round level, with the 200-day Simple Moving Average (SMA) converging at that point and reinforcing this area as a strong resistance. Once broken through that zone, a string of pivotal levels, such as 105.53 and 105.89, will present as caps.
On the downside, the 103.00 round level could be considered a bearish target in case US yields roll off on the back of the Fed communication later this Wednesday, with even 101.90 not unthinkable if markets further capitulate on their long-term US Dollar holdings.
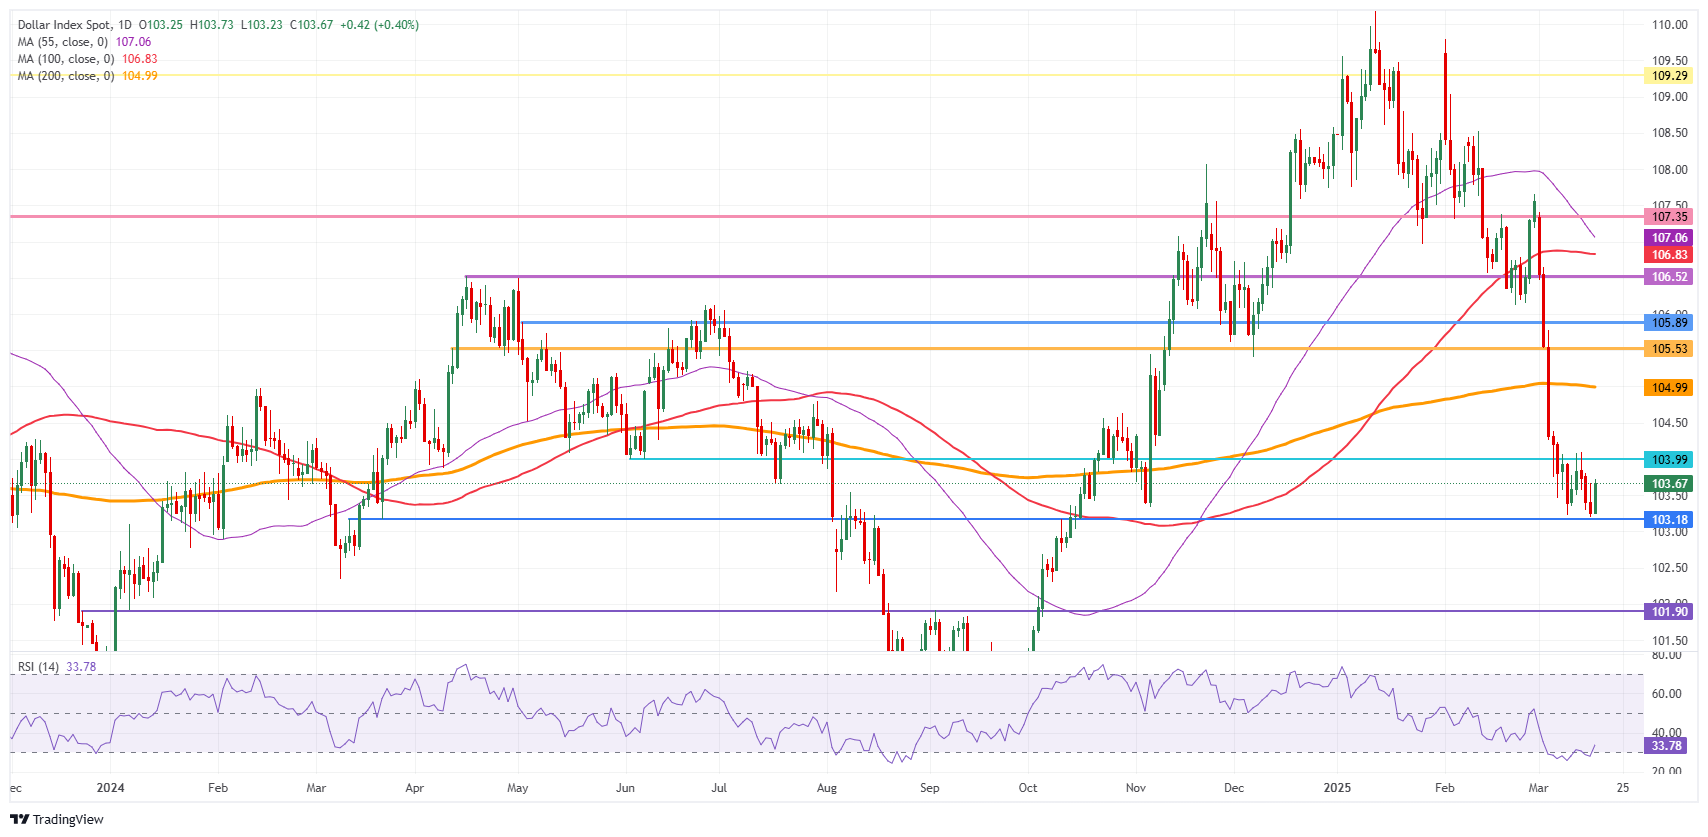
US Dollar Index: Daily Chart
Dot Plot FAQs
The “Dot Plot” is the popular name of the interest-rate projections by the Federal Open Market Committee (FOMC) of the US Federal Reserve (Fed), which implements monetary policy. These are published in the Summary of Economic Projections, a report in which FOMC members also release their individual projections on economic growth, the unemployment rate and inflation for the current year and the next few ones. The document consists of a chart plotting interest-rate projections, with each FOMC member’s forecast represented by a dot. The Fed also adds a table summarizing the range of forecasts and the median for each indicator. This makes it easier for market participants to see how policymakers expect the US economy to perform in the near, medium and long term.
The US Federal Reserve publishes the “Dot Plot” once every other meeting, or in four of the eight yearly scheduled meetings. The Summary of Economic Projections report is published along with the monetary policy decision.
The “Dot Plot” gives a comprehensive insight into the expectations from Federal Reserve (Fed) policymakers. As projections reflect each official’s projection for interest rates at the end of each year, it is considered a key forward-looking indicator. By looking at the “Dot Plot” and comparing the data to current interest-rate levels, market participants can see where policymakers expect rates to head to and the overall direction of monetary policy. As projections are released quarterly, the “Dot Plot” is widely used as a guide to figure out the terminal rate and the possible timing of a policy pivot.
The most market-moving data in the “Dot Plot” is the projection of the federal funds rate. Any change compared with previous projections is likely to influence the US Dollar (USD) valuation. Generally, if the “Dot Plot” shows that policymakers expect higher interest rates in the near term, this tends to be bullish for USD. Likewise, if projections point to lower rates ahead, the USD is likely to weaken.
Forex News
Keep up with the financial markets, know what's happening and what is affecting the markets with our latest market updates. Analyze market movers, trends and build your trading strategies accordingly.