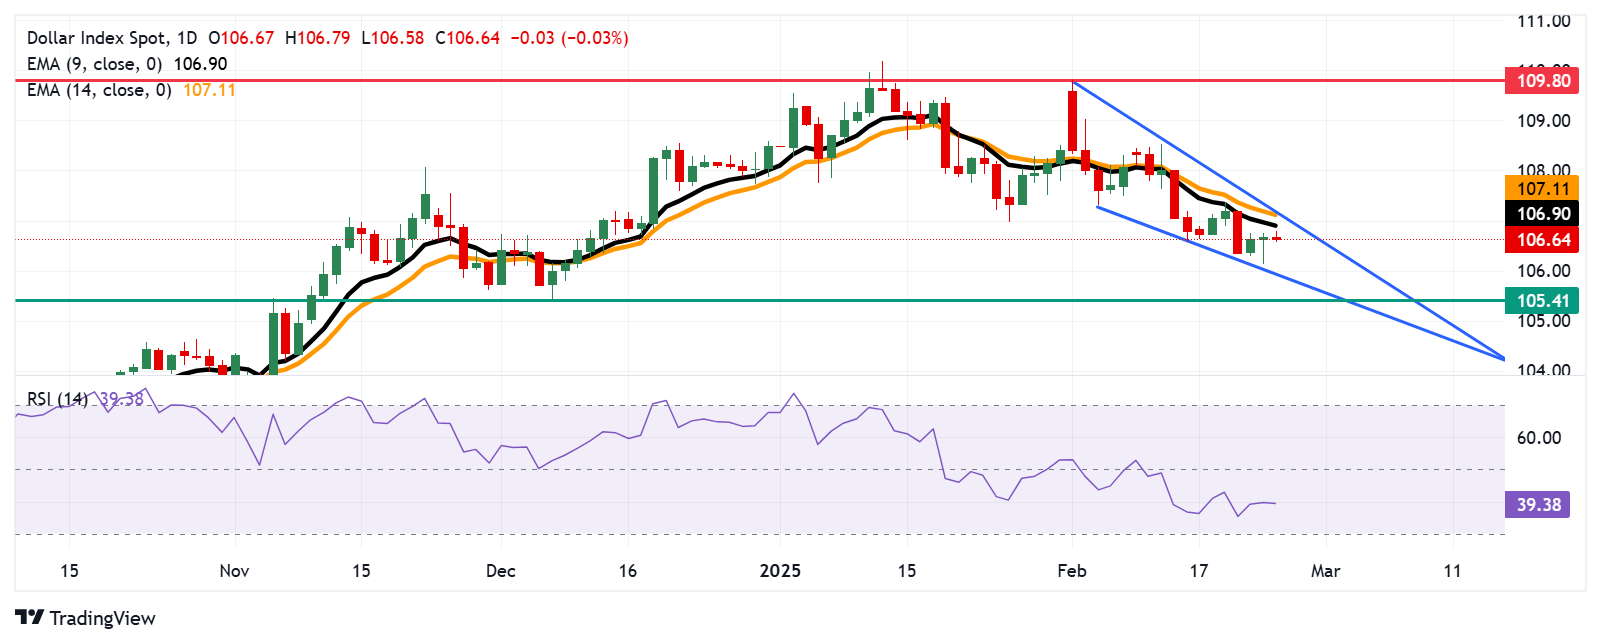
US Dollar Index Price Forecast: Could test nine-day EMA barrier near 107.00
- The US Dollar Index may find primary support around the falling wedge’s lower boundary at 105.90.
- The 14-day RSI remains below 50, reinforcing bearish bias.
- The nine-day EMA of 106.89 appears as the immediate resistance.
The US Dollar Index (DXY), which measures the value of the US Dollar (USD) against its six major peers, edges lower after registering gains in the previous two successive sessions, trading around 106.70 during the early European hours on Friday. However, the analysis of the daily chart indicates a potential bullish reversal, with the index moving within a falling wedge pattern.
The 14-day Relative Strength Index (RSI) remains below the 50 level, signaling a strengthening bearish momentum. Additionally, the US Dollar Index is trading below the nine- and 14-day Exponential Moving Averages (EMAs), reinforcing a weakening short-term price trend.
On the downside, the US Dollar Index may navigate the region around the lower boundary of the falling wedge at 105.90. A break below this critical support zone could strengthen the bearish bias, potentially driving the index toward the three-month low of 105.41, last seen on December 6.
The DXY’s key resistance is at the nine-day EMA of 106.89, followed by the 14-day EMA at 107.11, aligning with the lower boundary of the falling wedge pattern. A clear breakout above this crucial resistance zone could drive the index toward the six-week high of 109.80, last reached on February 3.
US Dollar Index: Daily Chart
US Dollar PRICE Today
The table below shows the percentage change of US Dollar (USD) against listed major currencies today. US Dollar was the strongest against the New Zealand Dollar.
| USD | EUR | GBP | JPY | CAD | AUD | NZD | CHF | |
|---|---|---|---|---|---|---|---|---|
| USD | -0.04% | 0.00% | -0.25% | 0.00% | 0.09% | 0.09% | -0.05% | |
| EUR | 0.04% | 0.04% | -0.19% | 0.04% | 0.12% | 0.13% | -0.01% | |
| GBP | -0.00% | -0.04% | -0.26% | -0.01% | 0.07% | 0.08% | -0.06% | |
| JPY | 0.25% | 0.19% | 0.26% | 0.23% | 0.32% | 0.31% | 0.18% | |
| CAD | -0.01% | -0.04% | 0.00% | -0.23% | 0.09% | 0.08% | -0.05% | |
| AUD | -0.09% | -0.12% | -0.07% | -0.32% | -0.09% | 0.00% | -0.14% | |
| NZD | -0.09% | -0.13% | -0.08% | -0.31% | -0.08% | -0.00% | -0.14% | |
| CHF | 0.05% | 0.01% | 0.06% | -0.18% | 0.05% | 0.14% | 0.14% |
The heat map shows percentage changes of major currencies against each other. The base currency is picked from the left column, while the quote currency is picked from the top row. For example, if you pick the US Dollar from the left column and move along the horizontal line to the Japanese Yen, the percentage change displayed in the box will represent USD (base)/JPY (quote).
Forex News
Keep up with the financial markets, know what's happening and what is affecting the markets with our latest market updates. Analyze market movers, trends and build your trading strategies accordingly.