Gold price extends sideways consolidative price move; bulls retain control near all-time high
- Gold price remains close to all-time peak as rising trade tensions underpin safe-haven demand.
- Bets that the Fed will cut rates several times in 2025 lend additional support to the XAU/USD.
- The USD hangs near a multi-month low and further underpins the commodity ahead of the Fed.
Gold price (XAU/USD) struggles to gain any meaningful traction at the start of a new week and oscillates in a narrow band just below the all-time peak – levels beyond the $3,000 psychological mark touched on Friday. The near-term bias, meanwhile, seems tilted in favor of bulls amid worries about escalating trade tensions and their impact on the global economy. This, along with geopolitical risks, should continue to act as a tailwind for the safe-haven bullion.
Meanwhile, traders are now pricing in the possibility that the Federal Reserve (Fed) will cut interest rates several times this year amid a tariff-driven US economic slowdown, signs of a cooling labor market and softer inflation. This turns out to be another factor that benefits the non-yielding Gold price. However, a positive risk tone, bolstered by China's stimulus announced over the weekend, caps the XAU/USD pair ahead of the FOMC decision on Wednesday.
Daily Digest Market Movers: Gold price remains well supported by trade war jitters and Fed rate cut bets
- US Treasury Secretary Scott Bessent said late Sunday that he is not worried about recent market downturns because corrections are healthy and normal. Commenting on the chance of a recession, Bessent added that there are no guarantees. This, along with worries about the potential economic fallout from US President Donald Trump's trade tariffs, continues to act as a tailwind for the safe-haven Gold price.
- On the geopolitical front, Houthi leader Abdul Malik al-Houthi, following deadly US airstrikes, said on Sunday that his militants would target US ships in the Red Sea as long as the US continues its attacks on Yemen. In response, the US defense secretary said on Sunday that the US will continue attacking Yemen's Houthis until they stop attacks on shipping, raising the risk of a further escalation of conflict in the region.
- Meanwhile, an Israeli drone attack in northern Gaza killed at least nine people, including three journalists on Saturday. Israel’s military said that its forces have intervened to thwart threats by terrorists approaching its troops or planting bombs since the January 19 ceasefire took effect. The Israeli military added that six men killed in the strike were identified as members of the armed wings of Hamas.
- Market participants have been pricing in the possibility that the Federal Reserve will lower interest rates several times this year amid worries about an economic downturn on the back of the Trump administration's aggressive trade policies. This comes on top of softer US inflation figures released last week and signs of a cooling labor market, supporting prospects for further policy easing by the US central bank.
- In fact, the Fed funds futures suggest that the Fed could lower borrowing costs by 25 basis points each at the June, July, and October monetary policy meetings. The expectations were further reaffirmed by the University of Michigan Surveys on Friday, which showed that the Consumer Sentiment Index plunged to a nearly 2-1/2-year low in March. This keeps the US Dollar bulls on the defensive near a multi-month low.
- China’s State Council announced a special action plan on Sunday aimed at stimulating domestic consumption and introduced measures to increase household incomes. Adding to this, China’s Shenzhen eased its housing provident fund loan policies to stimulate the property market and clear the overhang. This, in turn, boosts investors' confidence and caps any meaningful gains for the safe-haven XAU/USD pair.
- Traders now look forward to Monday's US economic docket – featuring the release of monthly Retail Sales and the Empire State Manufacturing Index – for some impetus later during the North American session. The focus, however, will remain glued to the crucial FOMC decision on Wednesday, which will influence the USD price dynamics and provide a fresh directional impetus to the non-yielding yellow metal.
Gold price seems poised to extend a well-established multi-month-old uptrend; bulls not ready to give up yet
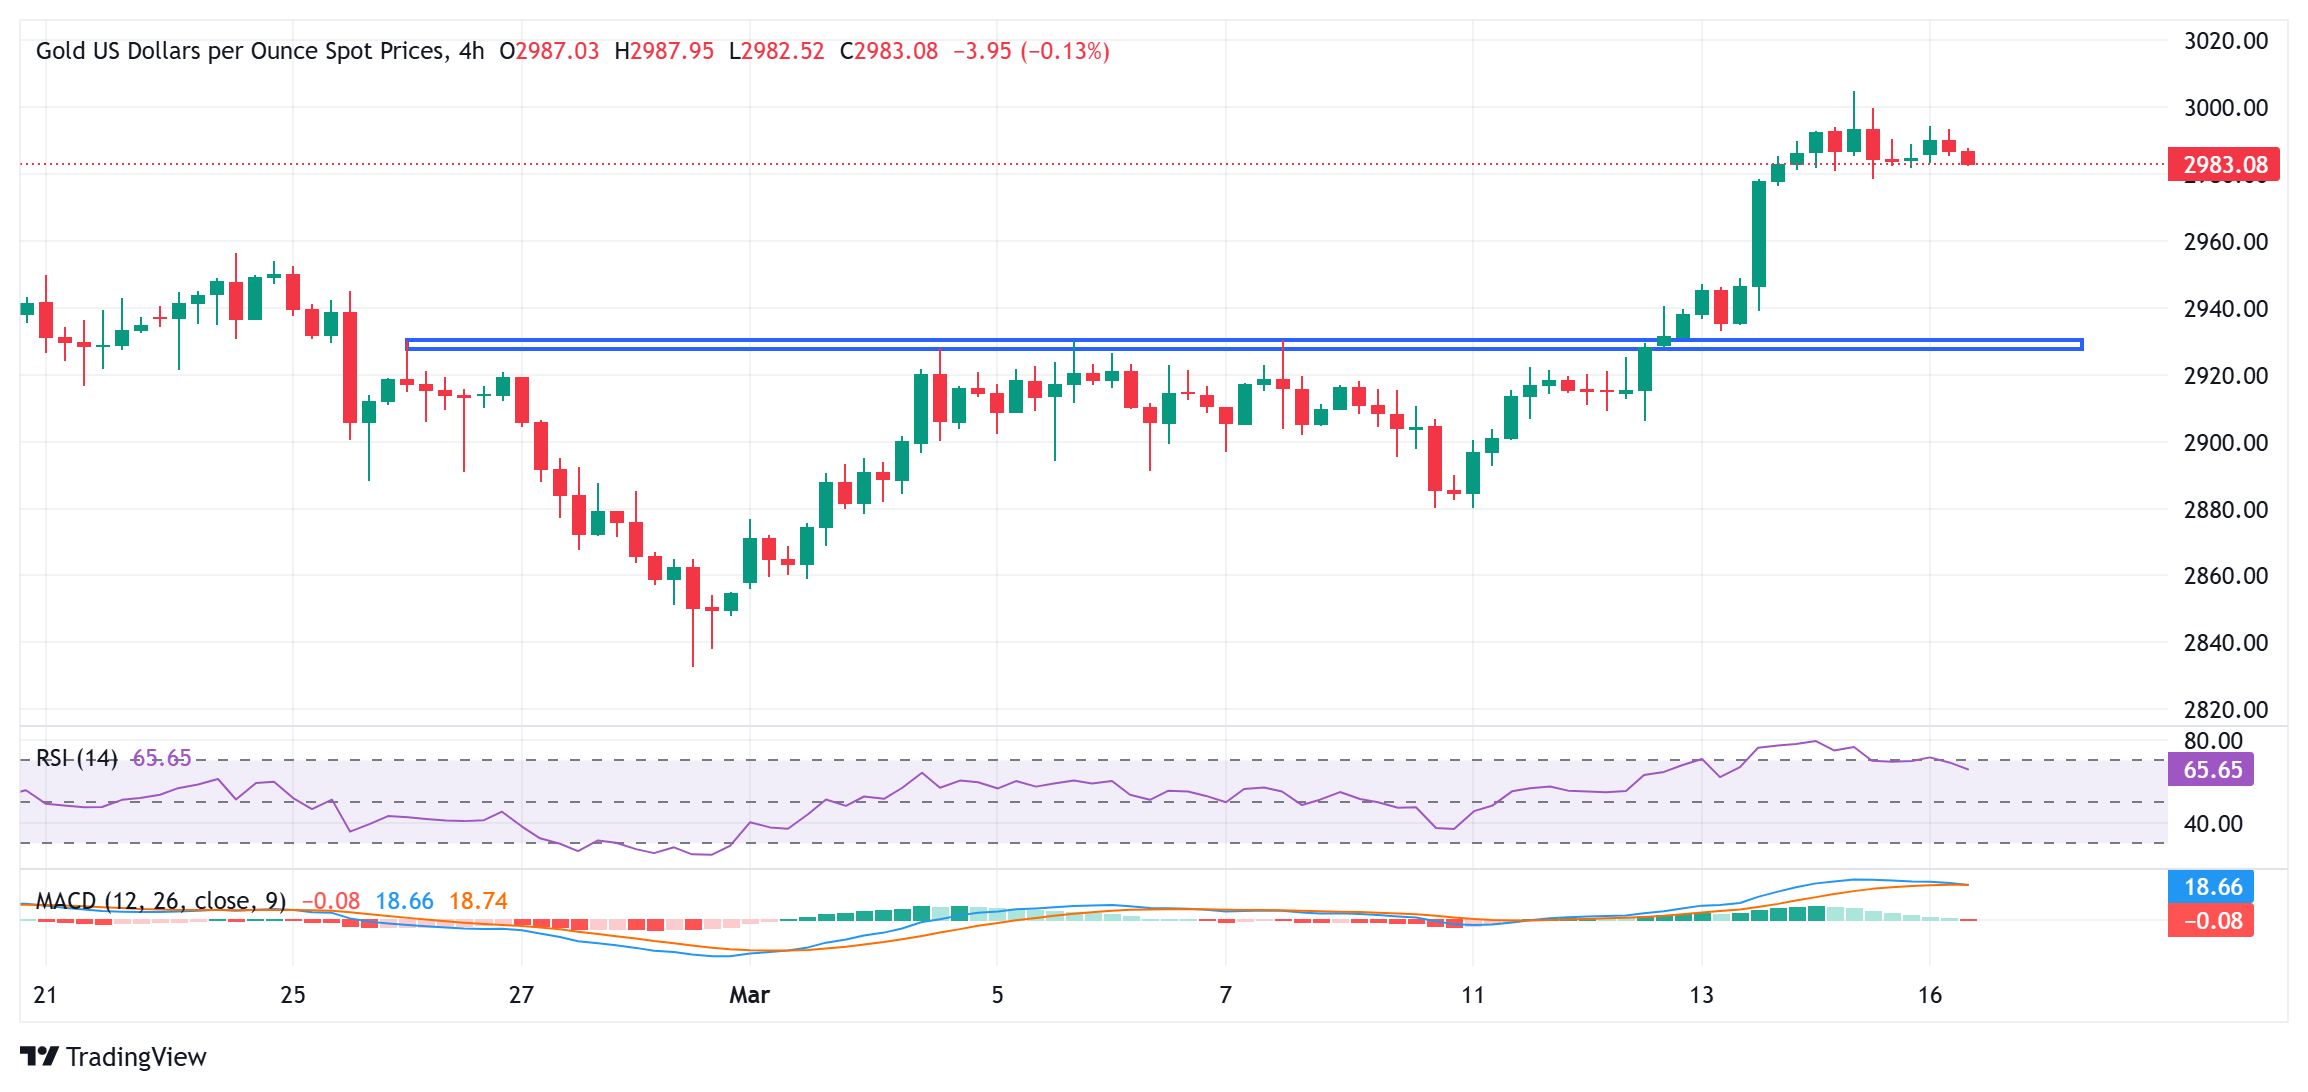
From a technical perspective, last week's breakout through the $2,928-2,930 horizontal resistance and a subsequent move was seen as a fresh trigger for bulls. That said, the daily Relative Strength Index (RSI) remains close to the overbought territory and is holding back traders from placing fresh bullish bets around the Gold price. Hence, it will be prudent to wait for some near-term consolidation or a modest pullback before the next leg up. Nevertheless, the broader setup suggests that the path of least resistance for the XAU/USD pair remains to the upside and supports prospects for an extension of a well-established uptrend witnessed over the past three months or so.
Meanwhile, any meaningful corrective slide might now attract fresh buyers near the $2,956 resistance breakpoint, below which the Gold price could drop to the $2,930-2,928 horizontal zone. The latter should act as a key pivotal point. A convincing break below might prompt some technical selling and pave the way for deeper losses. The XAU/USD pair might then accelerate the fall towards the $2,900 round figure en route to last week's swing low, around the $2,880 region.
US Dollar PRICE Last 30 days
The table below shows the percentage change of US Dollar (USD) against listed major currencies last 30 days. US Dollar was the strongest against the Canadian Dollar.
| USD | EUR | GBP | JPY | CAD | AUD | NZD | CHF | |
|---|---|---|---|---|---|---|---|---|
| USD | -3.87% | -2.94% | -2.50% | 1.25% | -0.31% | -1.68% | -2.15% | |
| EUR | 3.87% | 0.97% | 1.43% | 5.32% | 3.70% | 2.28% | 1.79% | |
| GBP | 2.94% | -0.97% | 0.46% | 4.30% | 2.70% | 1.29% | 0.81% | |
| JPY | 2.50% | -1.43% | -0.46% | 3.83% | 2.23% | 0.83% | 0.34% | |
| CAD | -1.25% | -5.32% | -4.30% | -3.83% | -1.55% | -2.88% | -3.36% | |
| AUD | 0.31% | -3.70% | -2.70% | -2.23% | 1.55% | -1.37% | -1.85% | |
| NZD | 1.68% | -2.28% | -1.29% | -0.83% | 2.88% | 1.37% | -0.48% | |
| CHF | 2.15% | -1.79% | -0.81% | -0.34% | 3.36% | 1.85% | 0.48% |
The heat map shows percentage changes of major currencies against each other. The base currency is picked from the left column, while the quote currency is picked from the top row. For example, if you pick the US Dollar from the left column and move along the horizontal line to the Japanese Yen, the percentage change displayed in the box will represent USD (base)/JPY (quote).
Forex News
Keep up with the financial markets, know what's happening and what is affecting the markets with our latest market updates. Analyze market movers, trends and build your trading strategies accordingly.